Resolves upon publication of the 2025 DHS Yearbook of Immigration Statistics, or earlier if official DHS data is available that can reasonably be expected to contain identical data to what will be in the Yearbook:
https://ohss.dhs.gov/topics/immigration/yearbook
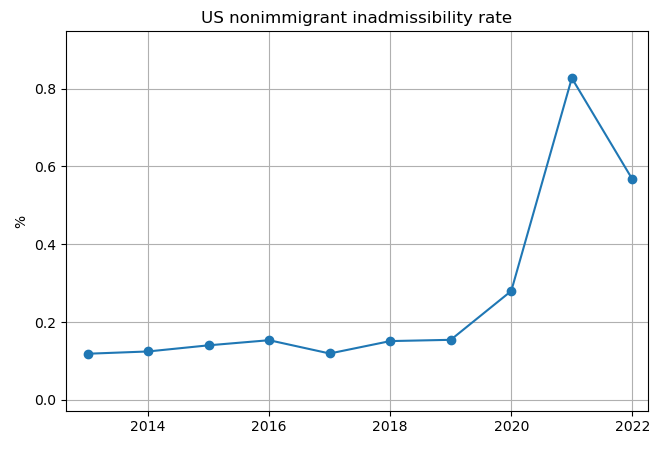
The US nonimmigrant inadmissibility rate for the purposes of this market is defined as:rate = inadmissible / (admissions + inadmissible)
If this rate is at least three times as high in 2025 as it was in 2024, the market resolves YES. Otherwise it resolves NO. Both the 2025 and 2024 rates will be calculated from data published in the 2025 yearbook, disregarding any data in the 2024 yearbook.
As an example, in the 2022 yearbook of immigration statistics:
https://ohss.dhs.gov/sites/default/files/2024-03/2023_0818_plcy_yearbook_immigration_statistics_fy2022.pdf
Total nonimmigrant admissions (Table 25, page 65):
2021: 35,300,000
2022: 96,800,000
Inadmissibility determinations are (Table 37, page 98):
2021: 294,351
2022: 551,928
Therefore the inadmissibility rate is:
2021: 0.83%
2022: 0.57%
Potentially more timely publication of some of the same data can be found here:
https://ohss.dhs.gov/topics/immigration
Though I'm yet to see a data table other than that in the Yearbook that includes all nonimmigrant admissions, and not only I-94 admissions.
 1,000
1,000People are also trading
@chrisjbillington just to confirm, this needs to wait for the actual yearbook to release, the relevant data tables, are not enough, right?
"We release data tables as they become available. We release the final yearbook PDF in September of the following fiscal year. "
But the 2023 Yearbook on that page still says "Download coming soon"
@DanielTilkin Ah! If the exact same data is available earlier, yes, I see no reason not to use it. I'll verify this and update the description if so.
@DanielTilkin Hm, I'm seeing that the Nonimmigrant Admissions Annual Flow Report only covers I-94 admissions, and not e.g. visa waiver program, most Canadian tourists (though this may change), etc. So that's not comprehensive compared to what's in the Yearbook.
And it looks like the 2023 Immigration Enforcement Actions Annual Flow Report (for inadmissibility numbers) isn't out yet either.
Nonetheless updating the description to say that early resolution is possible if data is available that can reasonably be expected to be identical to what will be in the Yearbook.
@chrisjbillington If it takes that long for the data to come out, you probably want to extend the closing date, otherwise you'd be locking up mana for a long time.
@DanielTilkin Oh, I could have sworn I picked a close date based on expected publication timeframe. In any case, extended until EOY 2026, and I intend to extend the close date further it needed.