Activity is tracked in terms of https://en.wikipedia.org/wiki/Accumulated_cyclone_energy. This Wikipedia page has a list of previous North Atlantic hurricane seasons by ACE.
If the value is 10 or more ACE away from one of the cutoff values, this market resolves in January 2026 to whatever value is listed on Wikipedia. If it is close to a cutoff, the market resolves after the reanalysis of all storms is completed (usually in April) to account for postseason adjustments in ACE.
The last ten years had the following activity:
Below normal: 2015
Near normal: 2022
Above normal: 2016, 2018, 2019, 2021, 2023
Hyperactive: 2017, 2020, 2024
The least active season in recorded history was 1914, while the most active season was 1933.
 1,000
1,000People are also trading
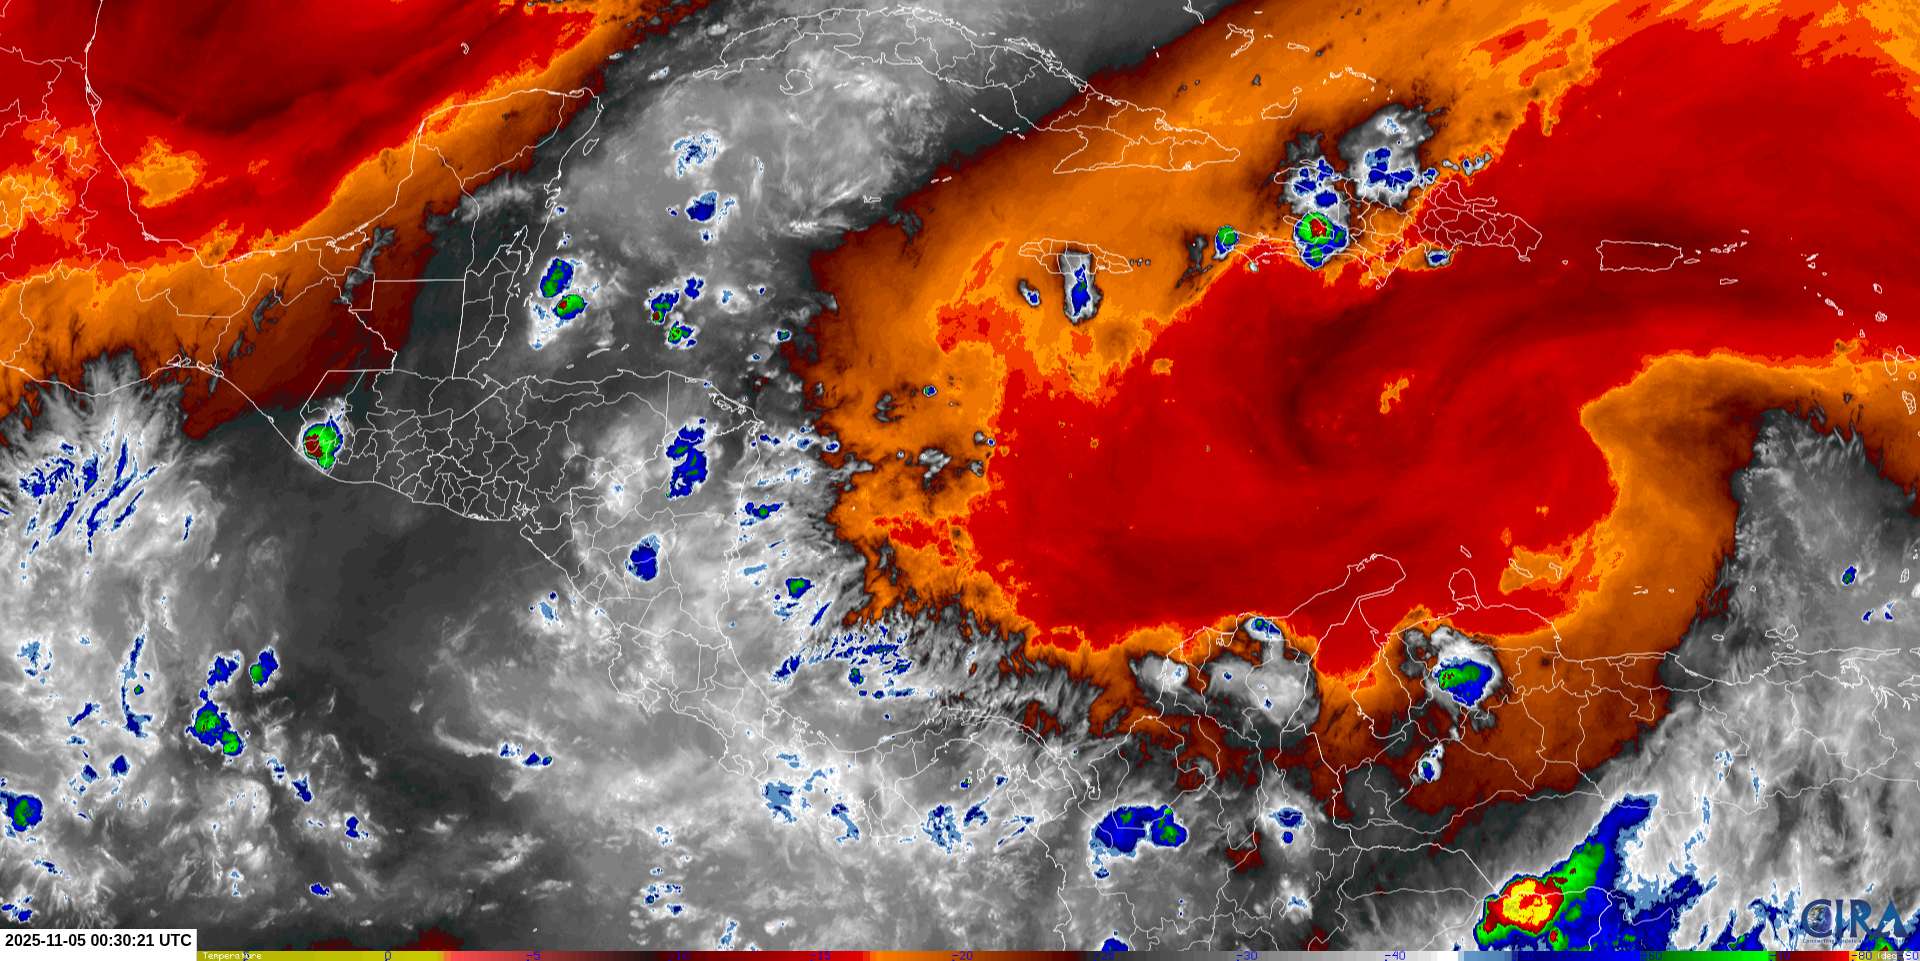
Latest CPC outlook makes no mention of TC activity in the Atlantic (or the East Pac for that matter even if there might be some marginal chances in a few days)....
~
Last week some model runs and CFS forecasts had indicated some chances of development over a narrow window over today/tomorrow...
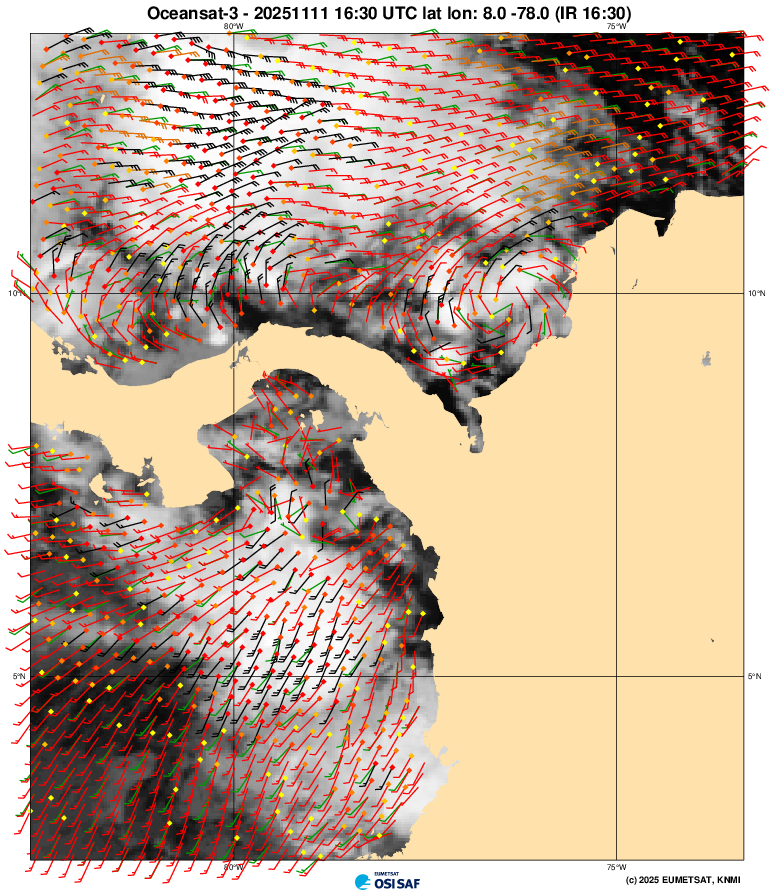
i.e. from a low level circulation spinning off of Columbia heading west i.e. as shown in TAFB surface analyses and below KNMI surface wind product...
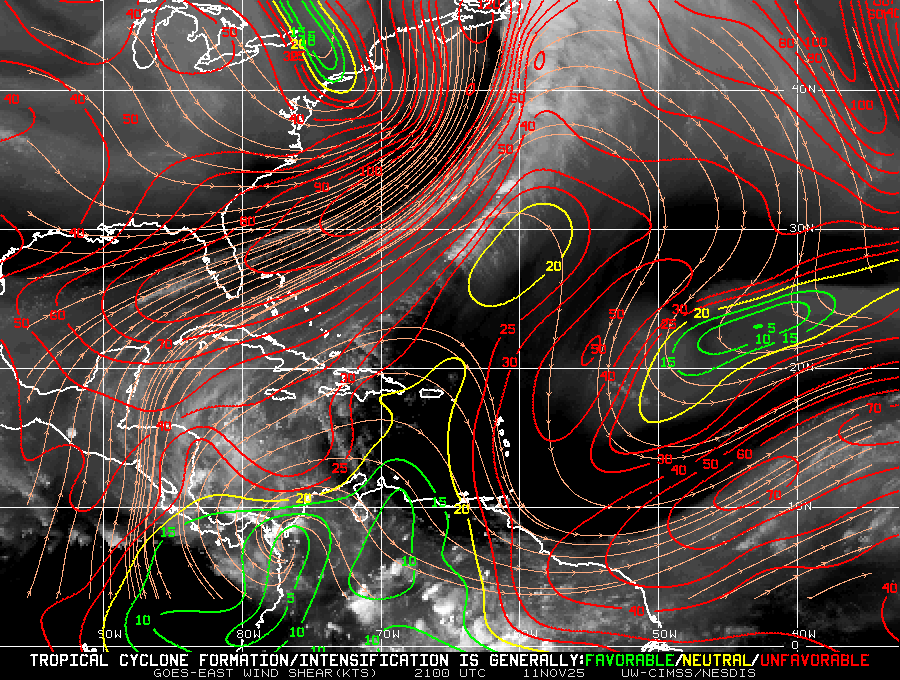
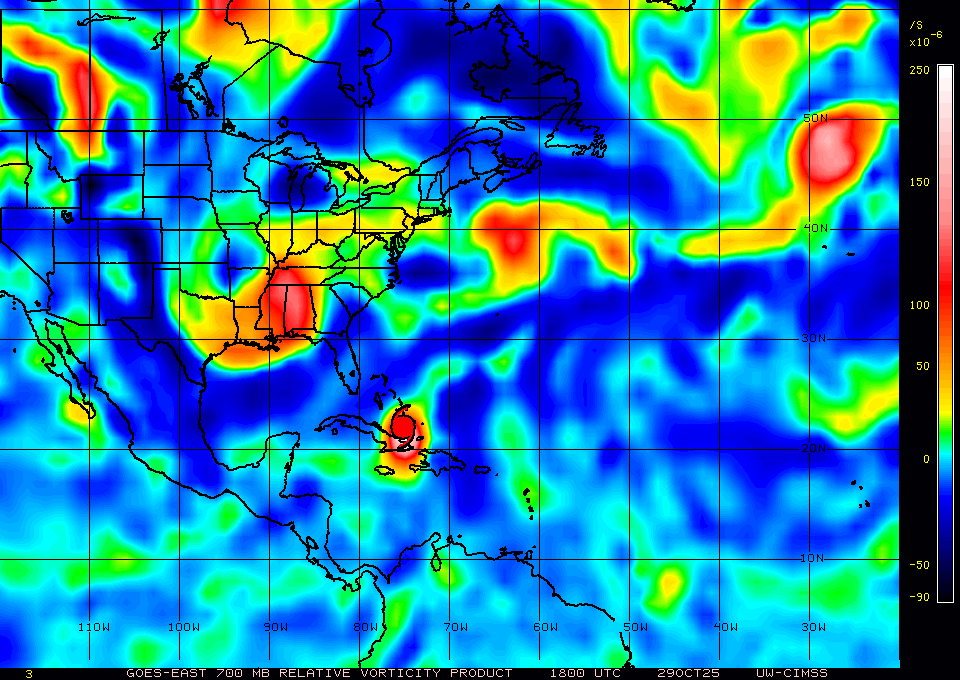
But chances for this particular window seem to have dried up under unfavorable conditions, especially persistent high VWS (CIMSS below), and the models dropped chances to nil for it in the Atlantic anyway for the last few days' model runs...
~
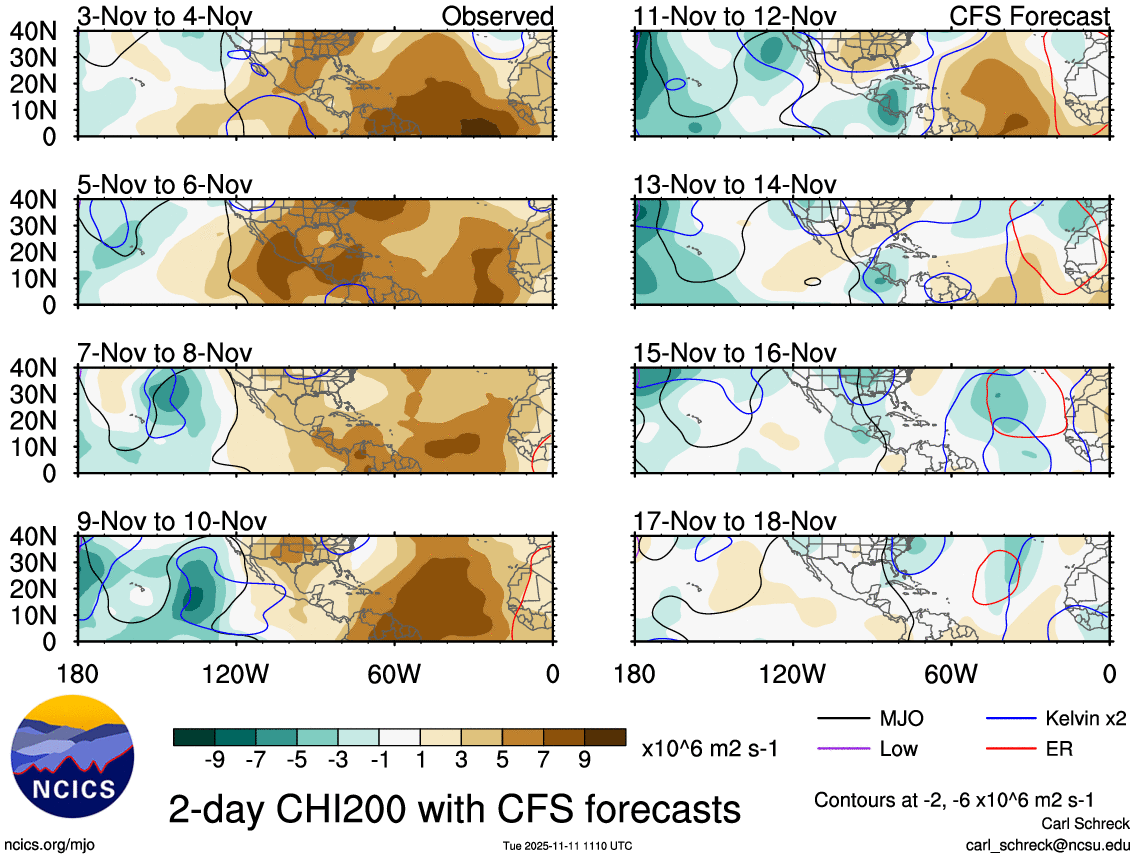
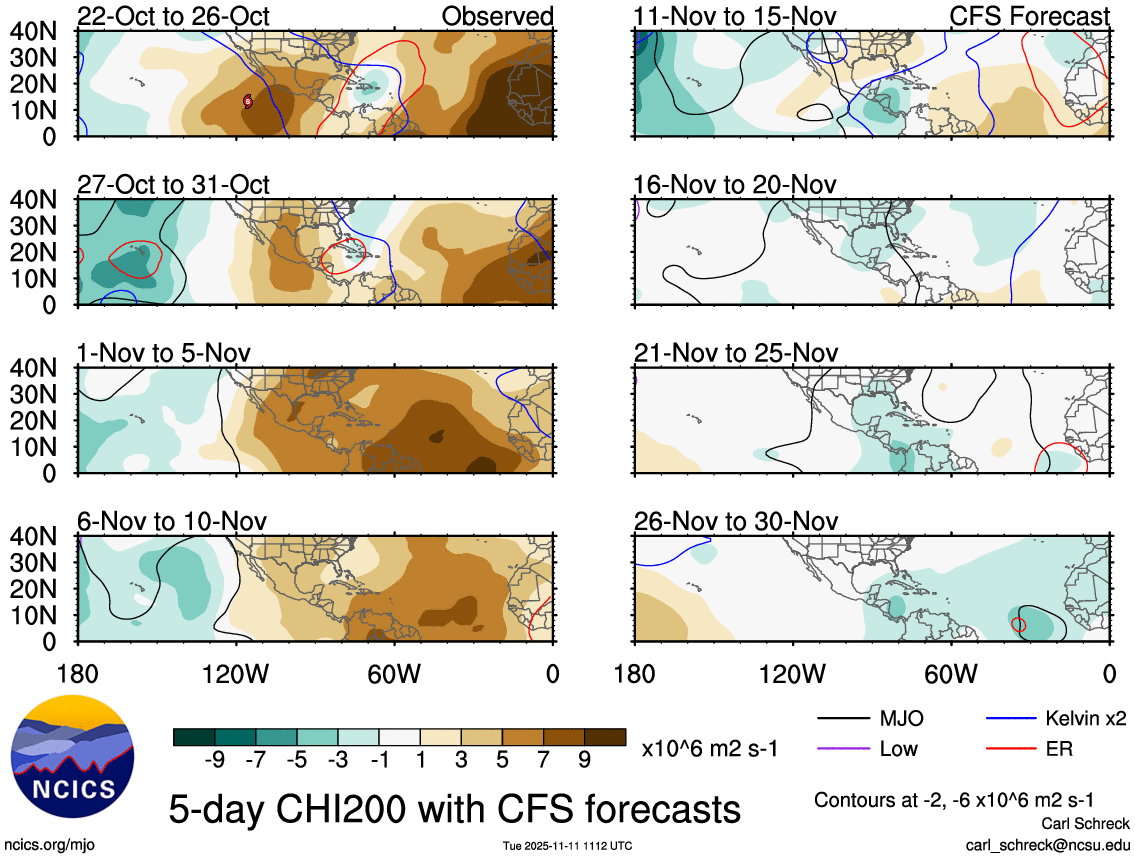
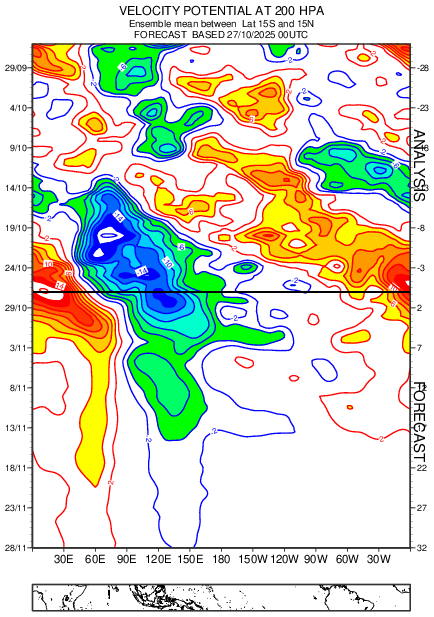
Going out further over the next week, drops in VP200 seem too short lived to provide sustained, favorable divergence ...
GEFS is still spinning up some disturbances over the weekend into Monday (15th-17th with 25% members with a 34 kt point) but in the context of larger ensembles it seems probability for that event is merely 5%
VP200 is also very low for that period per CFS
~
Further out, including beyond the medium range models, VP200 doesn't seem favorable...
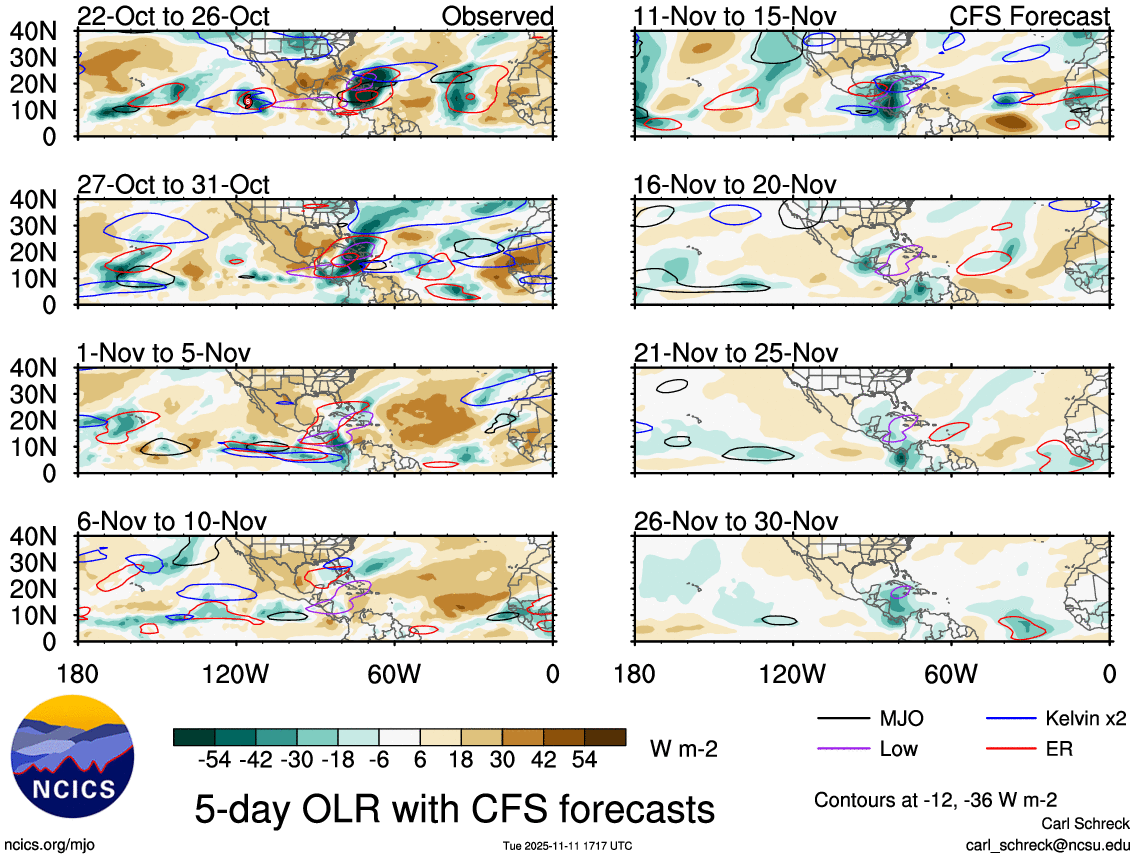
The OLR product does suggests some enhanced preciptiation potential at the end of the month. (This is beyond the medium range TC models),
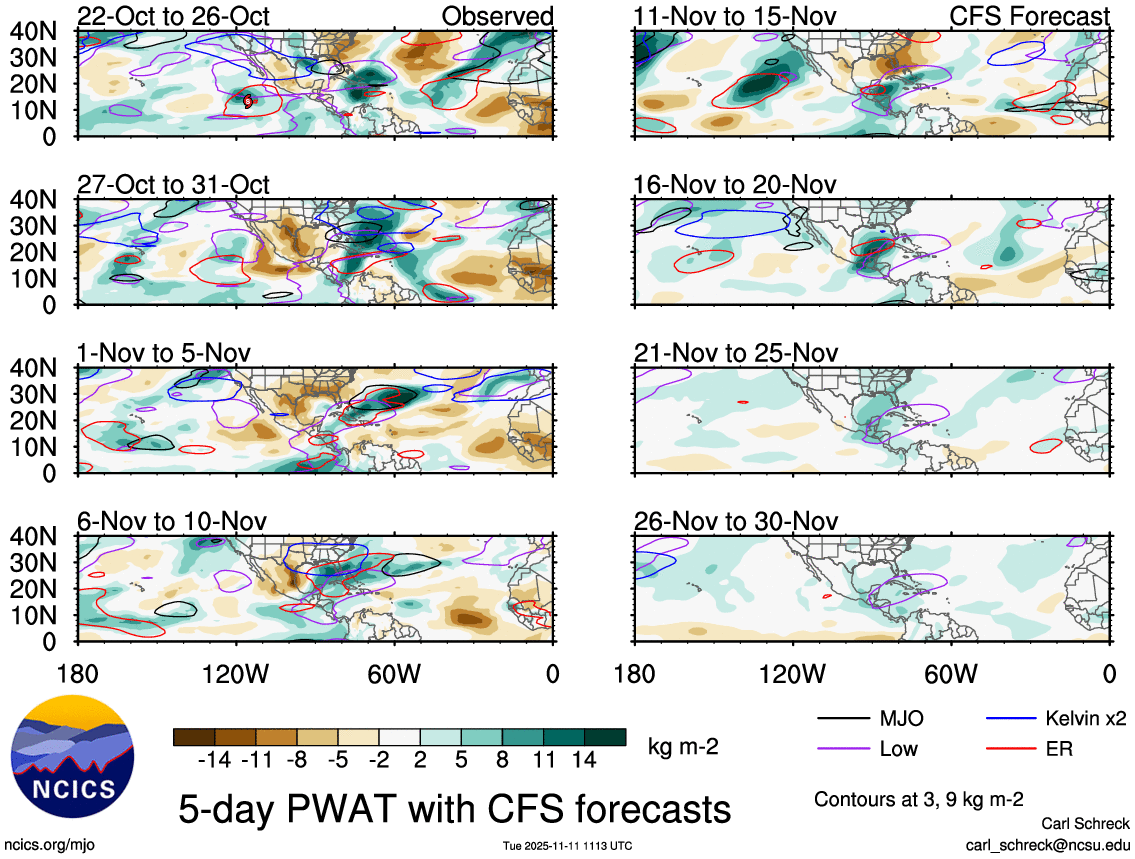
but overall PWAT looks too low for that end of the month period even if the shear is favorable.
So given the apparently drier environment and possibly insufficent divergence for the rest of the period I think (subjectively) the above indicates chances are now less than 10% for any future TS in November.
~
Given that I've now completely divested for this market, this is likely my last post for this market unless something very surprising happens.
Tracking Melissa last few days I failed to timely update on this market...
Today I quickly looked at NCICS/ECMWF TC products and past Google/EPS TC runs through 06Z/00Z, as well as the early model guidance from 12Z:
~
Google has been under-estimating the storm intensification after the NE turn towards Jamaica since the last few runs.. so it may be a bit under, however 06Z does show extra-tropical transition where I would expect it roughly based on SST temps, so I consider the full track this time... 12-18 more ACE from Google (mean & median of 16)
Looking at the early 12Z model guidance because of the upgrade.. (these only have 12 hour points so I have to interpolate them):
HCCA has ~18 ACE for its full track, but it definitely includes some extratropical points as the track doesn't have that information, so it should be an overestimate/on the high end
For the interpolated HAFS guidance (HFBI and HFAI) I get 15.9 and 17.6 ACE respectively for their whole track (which includes points that you would expect to be extra-tropical, so ~17 ACE seems a bit more reasonable).
So assuming no further storms in November and taking 17 ACE as a reasonable number given Google has been a bit under and the early guidance, and adjusting the 09Z colostate number without the 06Z best track point, since it is a Google 06Z run...
117.1 - 2.25 = 114.85 + 17 ~= 131.85 ACE
This puts us ~6 ACE (expected ~132 ACE once Melissa finishes) or so above the bin edge (perhaps a bit higher if Melissa intensity is higher before landfalling in Cuba given that the most recent 15Z advisory has it at 160kt, 892mb). However the Google/12Z does have lower ACE so it could be as much as 4 ACE lower. So these together it could be as low as 128 ACE by the time Meslissa finishes, but this is less likely.
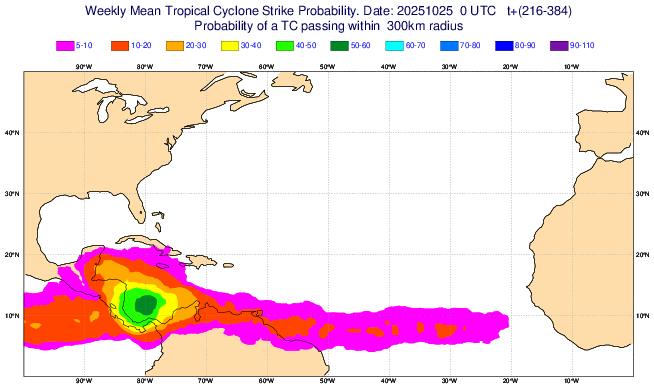
As mentioned before regarding the second half of next week for some very marginal chances of development in the Caribbean around Nov4-8 (developing and sticking close to the central american coast), when tracking the Melissa I did note some (now older) runs that I did see the weakest of signals from the Caribbean (usually 1-3 members) in the far range but they have disappeared in the last few runs (the highest generating 10 ACE for an high RI storm, and a few runs generating hurricanes).
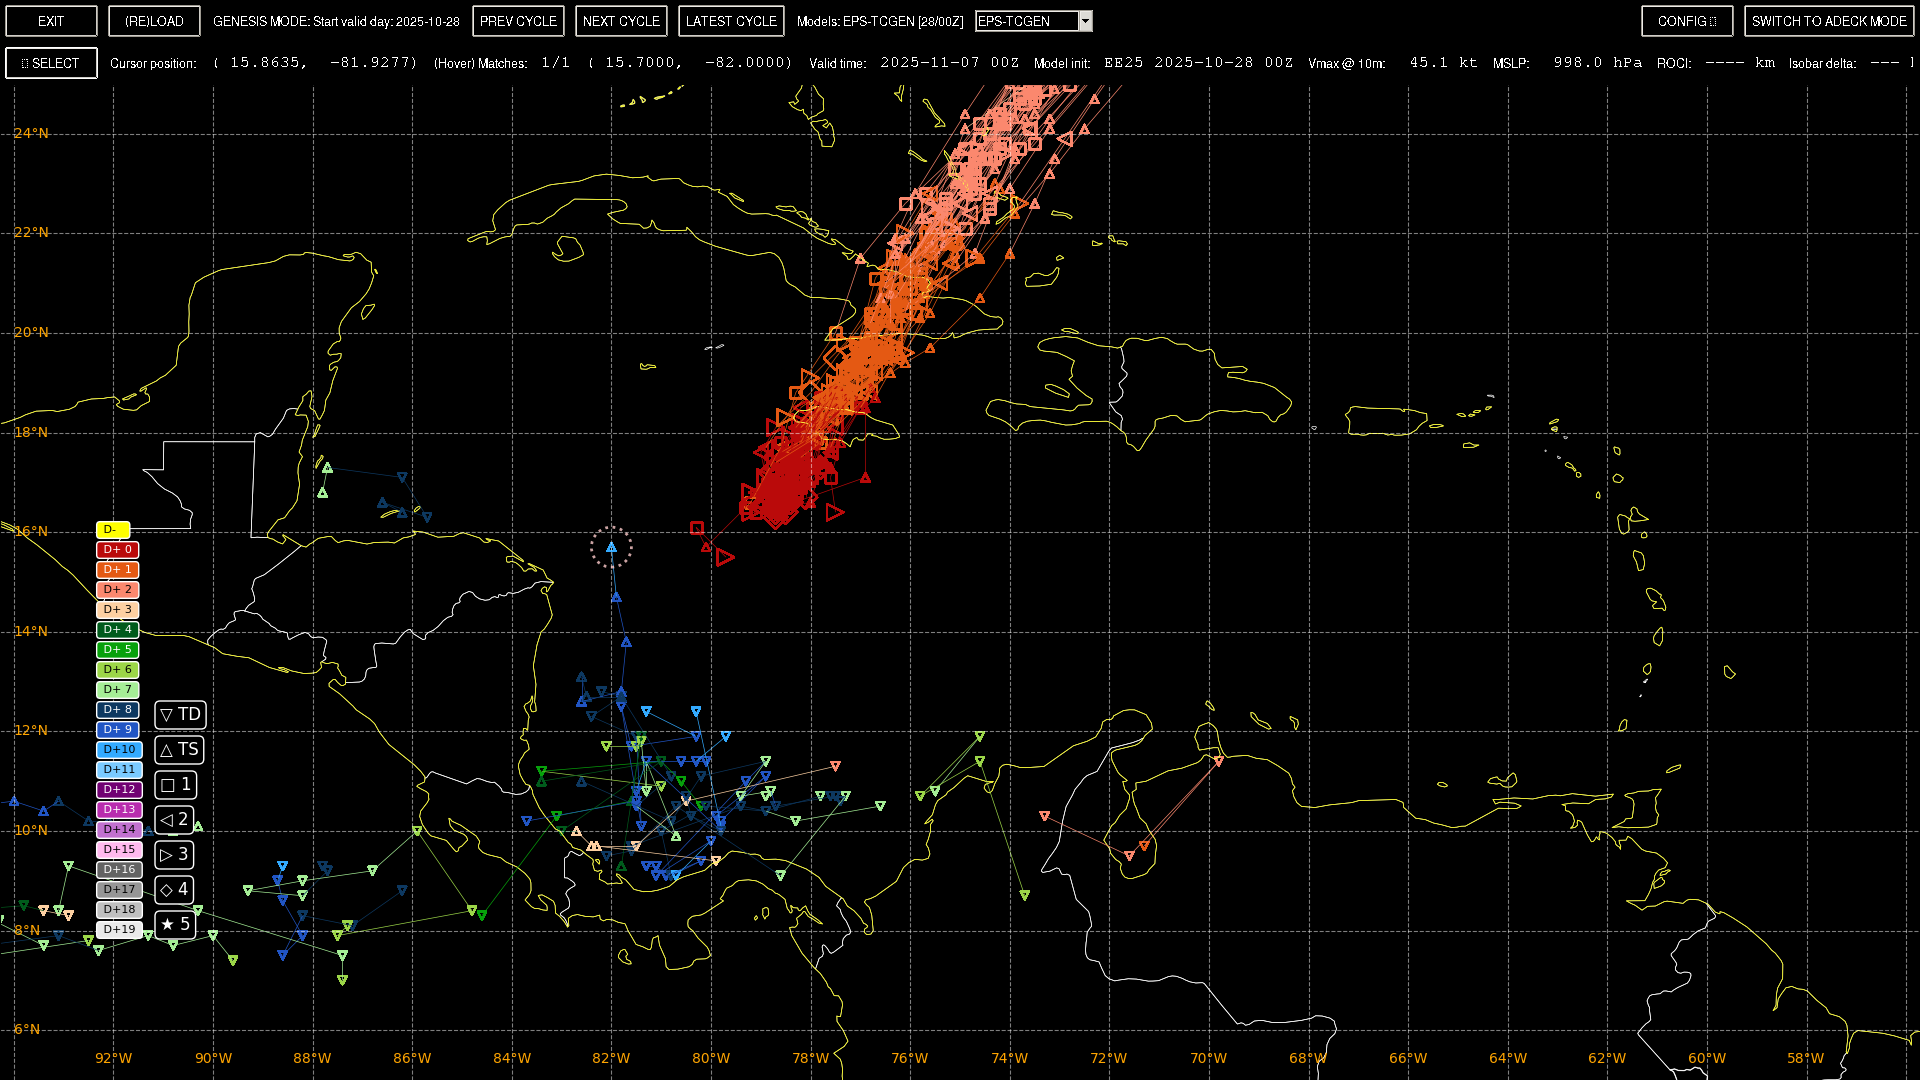
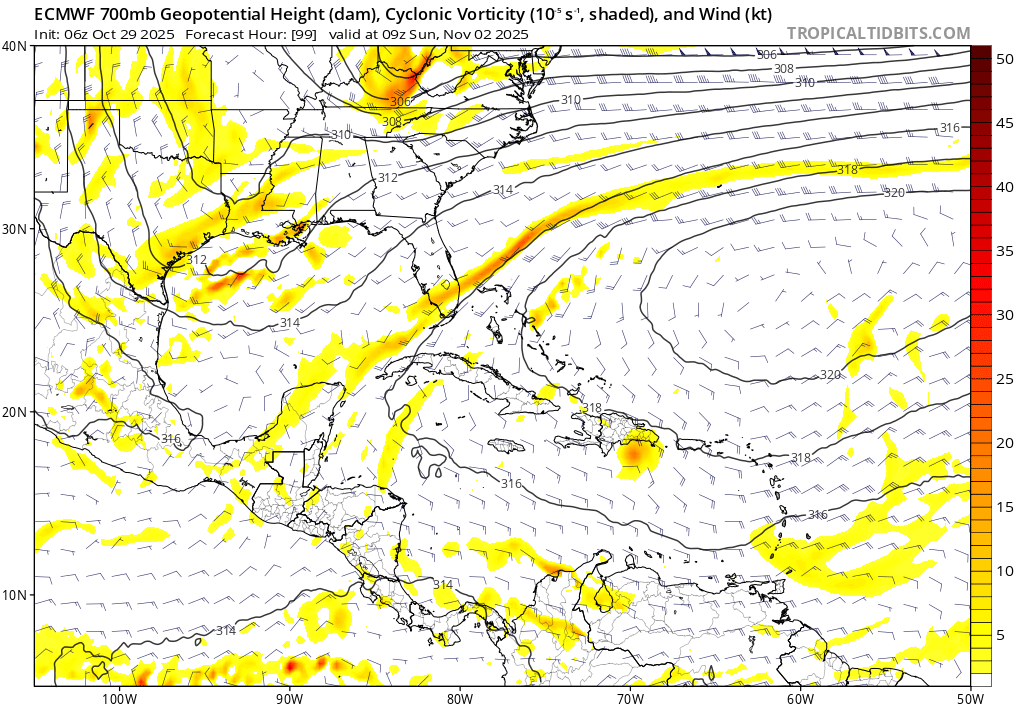
I do note in the latest EPS/00Z run it also shows the same marginal signal far out (<5%) of a TS through its 10 window, similar to the start of the second google image of a TS tracking towards Cuba (it's a incomplete track though as the TC product doesn't go out further in time)
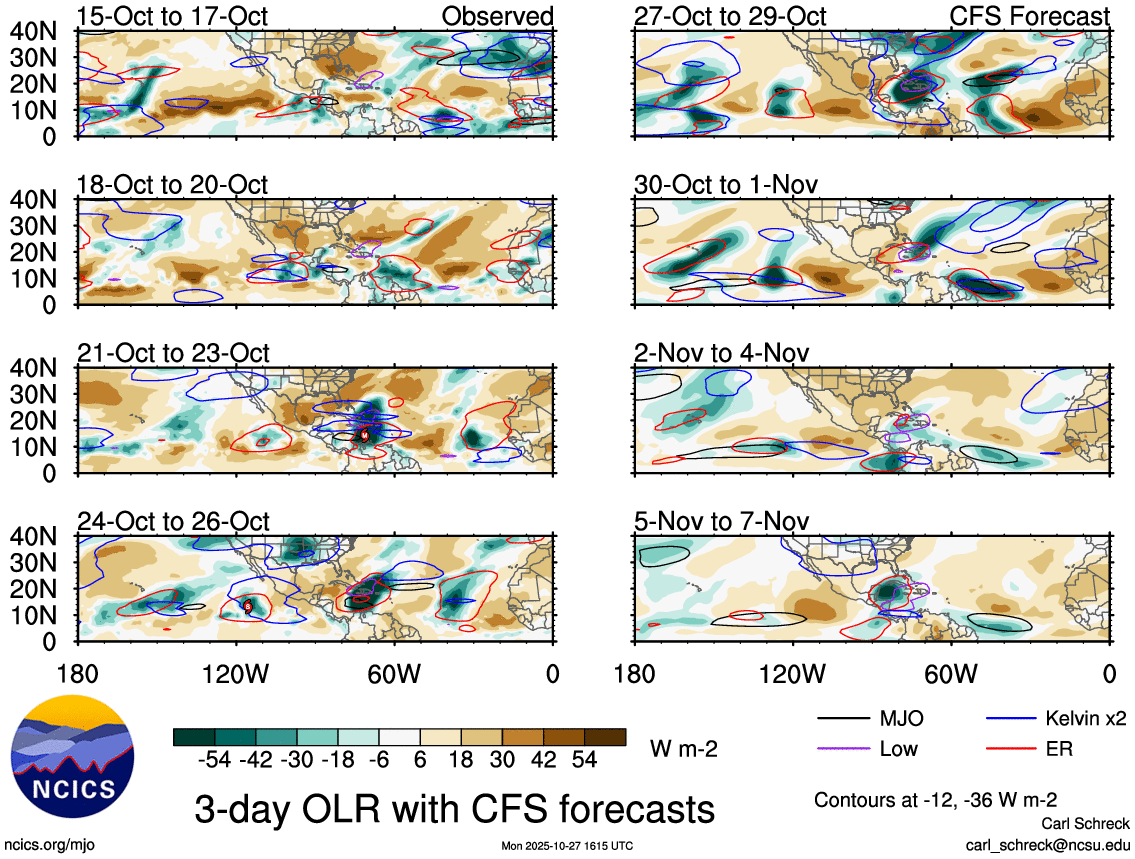
This weak signal is supported by various NCICS products from the CFS forecast (VP200, OLR, etc.) with some perhaps neutral shear (not ideal but its a multiple day average), the latest ECM tropiacal products showing enhanced chances of precipitation then, and the ECMWF tropical cyclone products showing 30% of a TC around Oct 8-9 (5% of a TS).
More speculatively longer range the ECMWF products do not indicate anything developing in the middle of November (below normal chances and ACE); with ACE being normal last week of November into December.
The NCICS (CFS based) products do show a low in the same region in the middle of November with a ER wave but this may be contributions from the same signal above crossing over into the period (indicating some chances for a possible TC in the middle of November). Chances look lower towards the end of November.
I do note that generally the shear is neutral to favorable for most of the latter half of November with some decent tradewinds to be expected from looking at CFS forecast, but even if a low pressure develops over Central America /Caribbean it seems more likely it will only be a broad low and not develop into a TC at the moment based on these weak signals.
~
The CPC extended outlook should be out later today that should have better guidance on what will happen in the middle of November...
Based on the above expected ACE it doesn't look like it will be very close to the bin edge, but I predict we still will end up within the 10 ACE of the bin edge, as I expect now a November storm being less likely (mainly per recent Google runs' signal disappearing for Nov5-8).
Based on past statistics and my previous reasoning I do not expect a large enough downgrade that the current market probabilities are far off if the current ACE forecast for Melissa validates, and note (subjectively) its possible with a modest post-season downgrade (2-3 ACE) together with some uncertainty in the final ACE for Melissa that we could we end up dropping into a Normal season after the final TCRs (a very large post-season downgrade of 5-10 by seems a very unlikely scenario historically), but these are both low probabilities and their joint probability should be much lower, so I have much less confidence in both happening together, thus will place a bet up for the above normal season respecting these scenarios.
~
some Images...
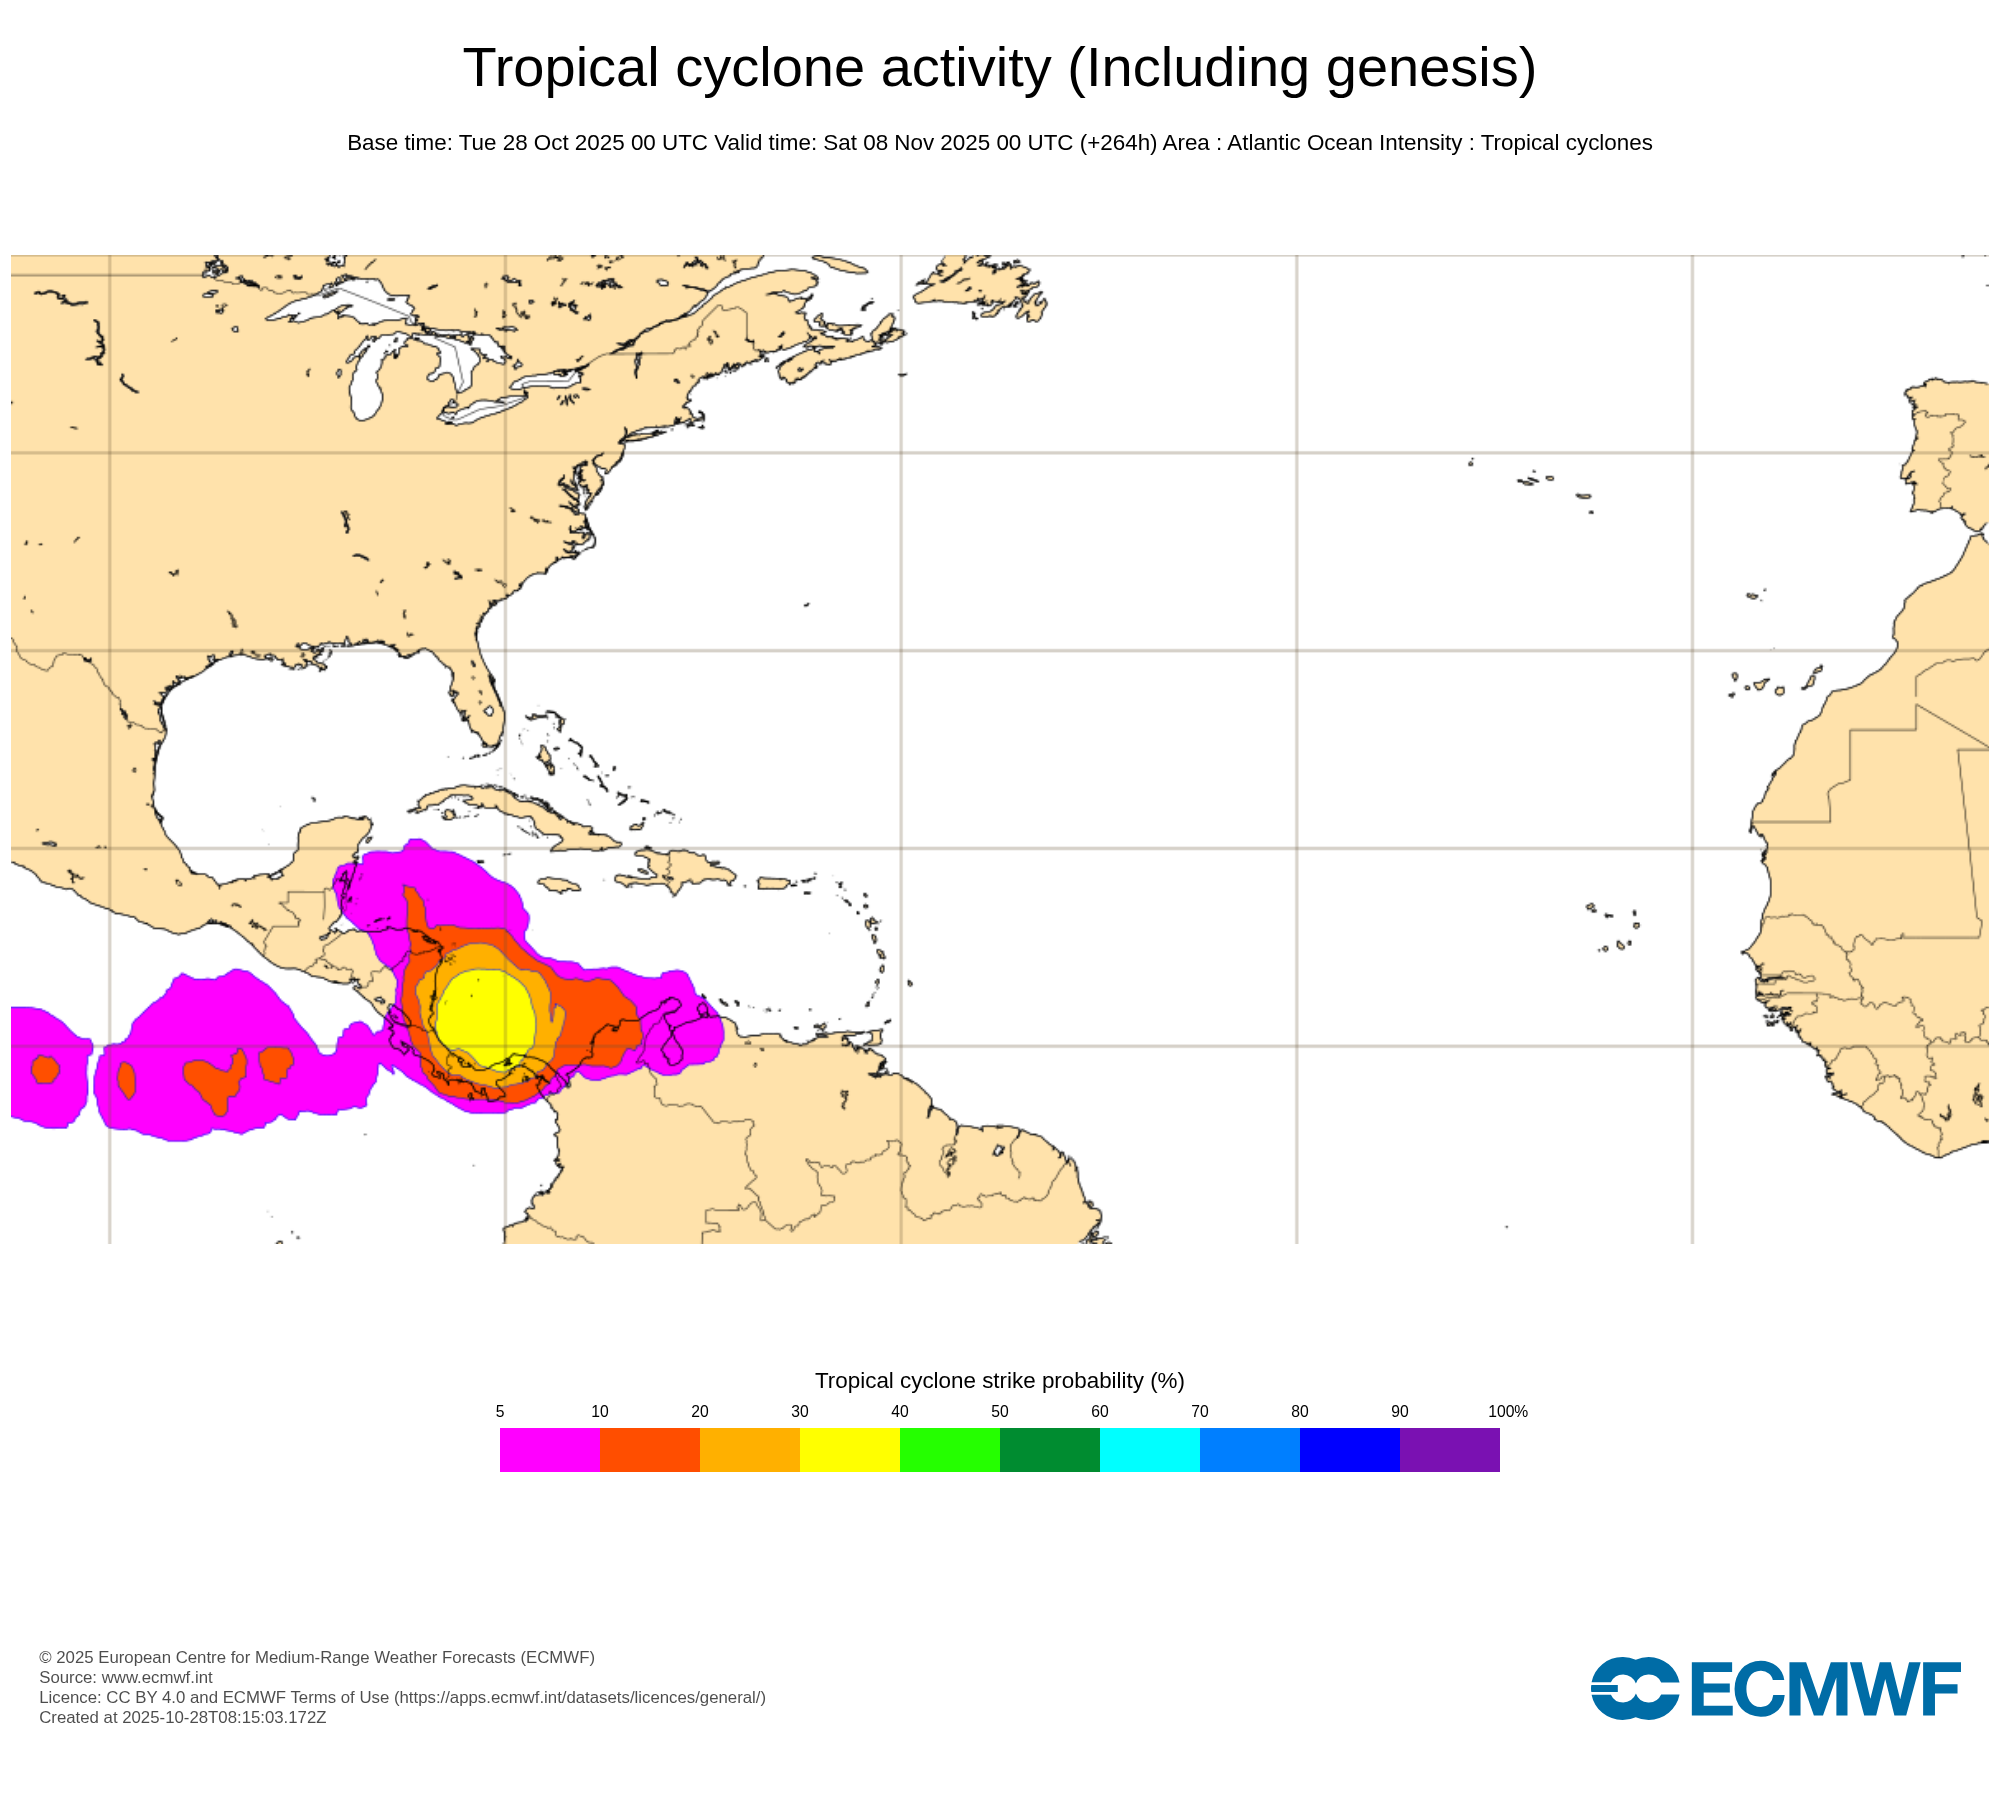
EMCWF TC Probability for that Nov5-8 storm (i.e. a TD or greater... TS is ~5%)
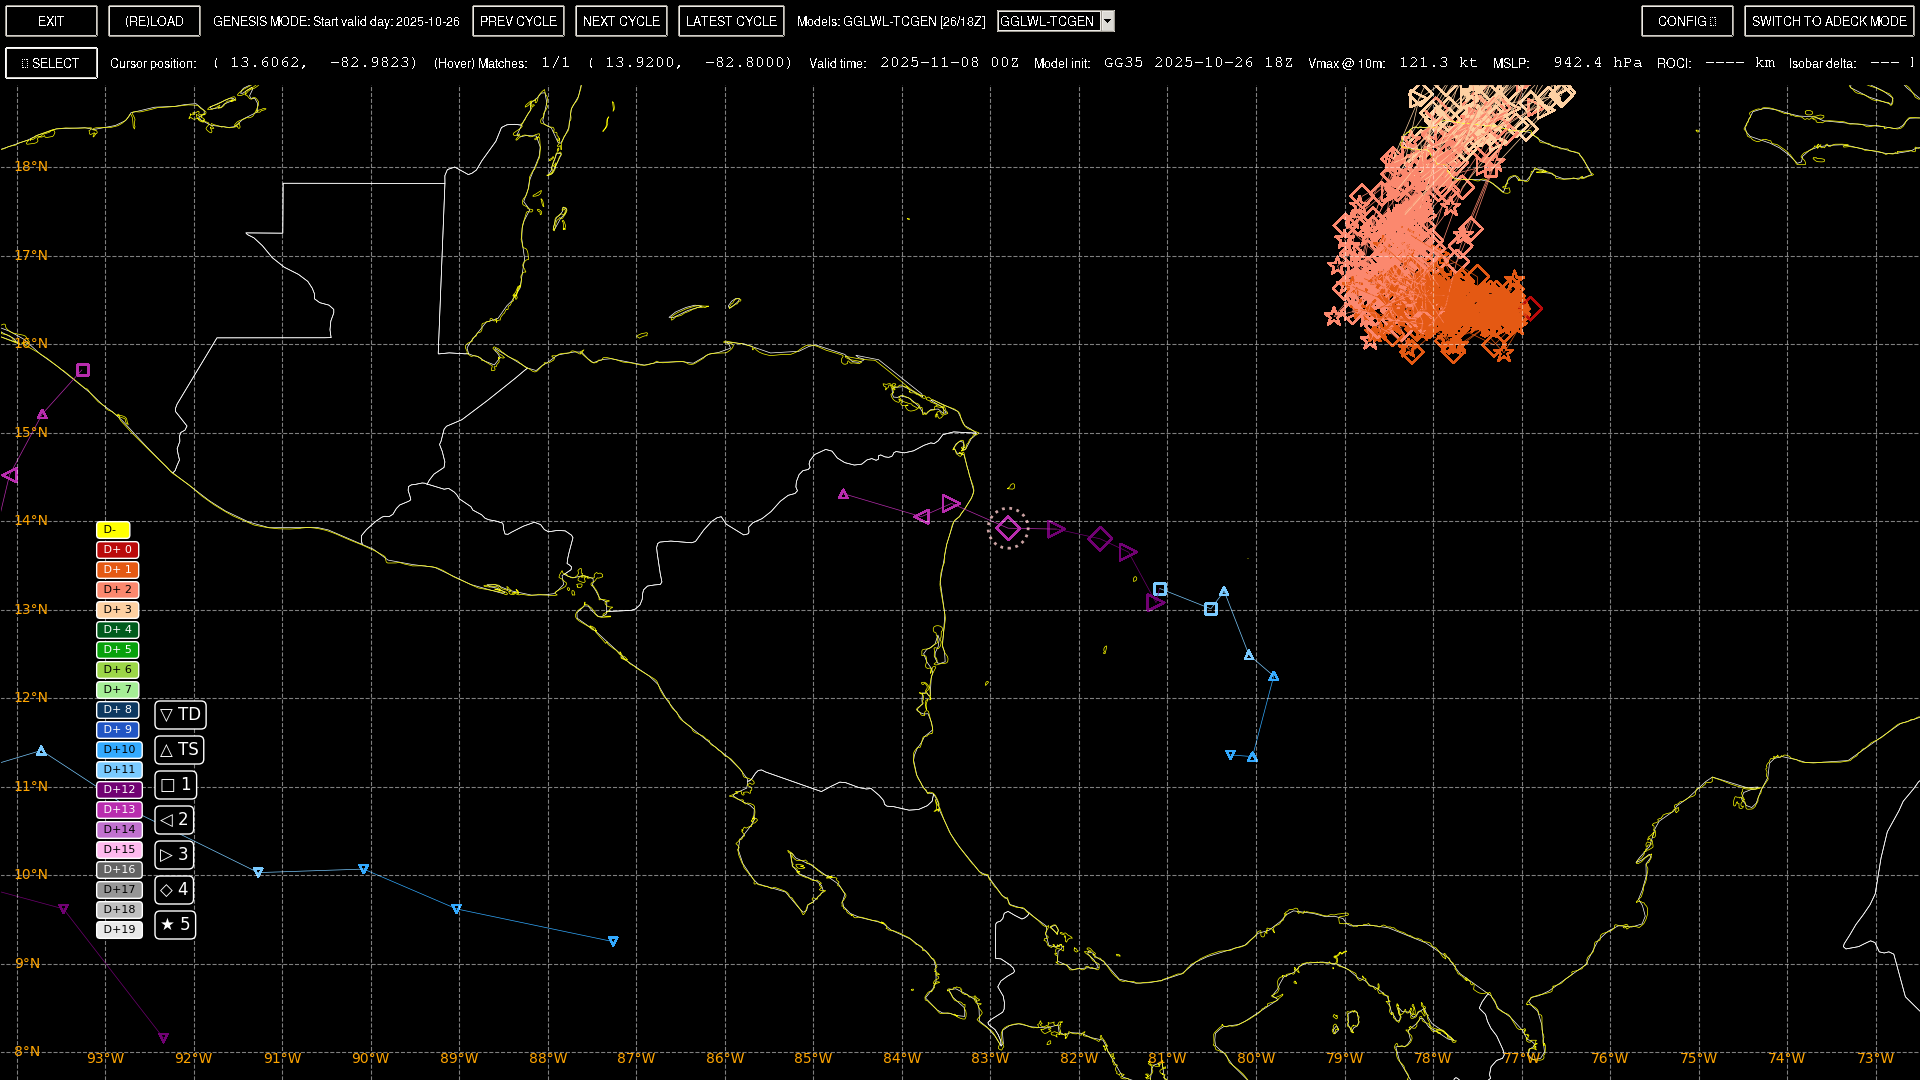
Old google runs... (examples of the ~10ACE and 5 ACE storms)
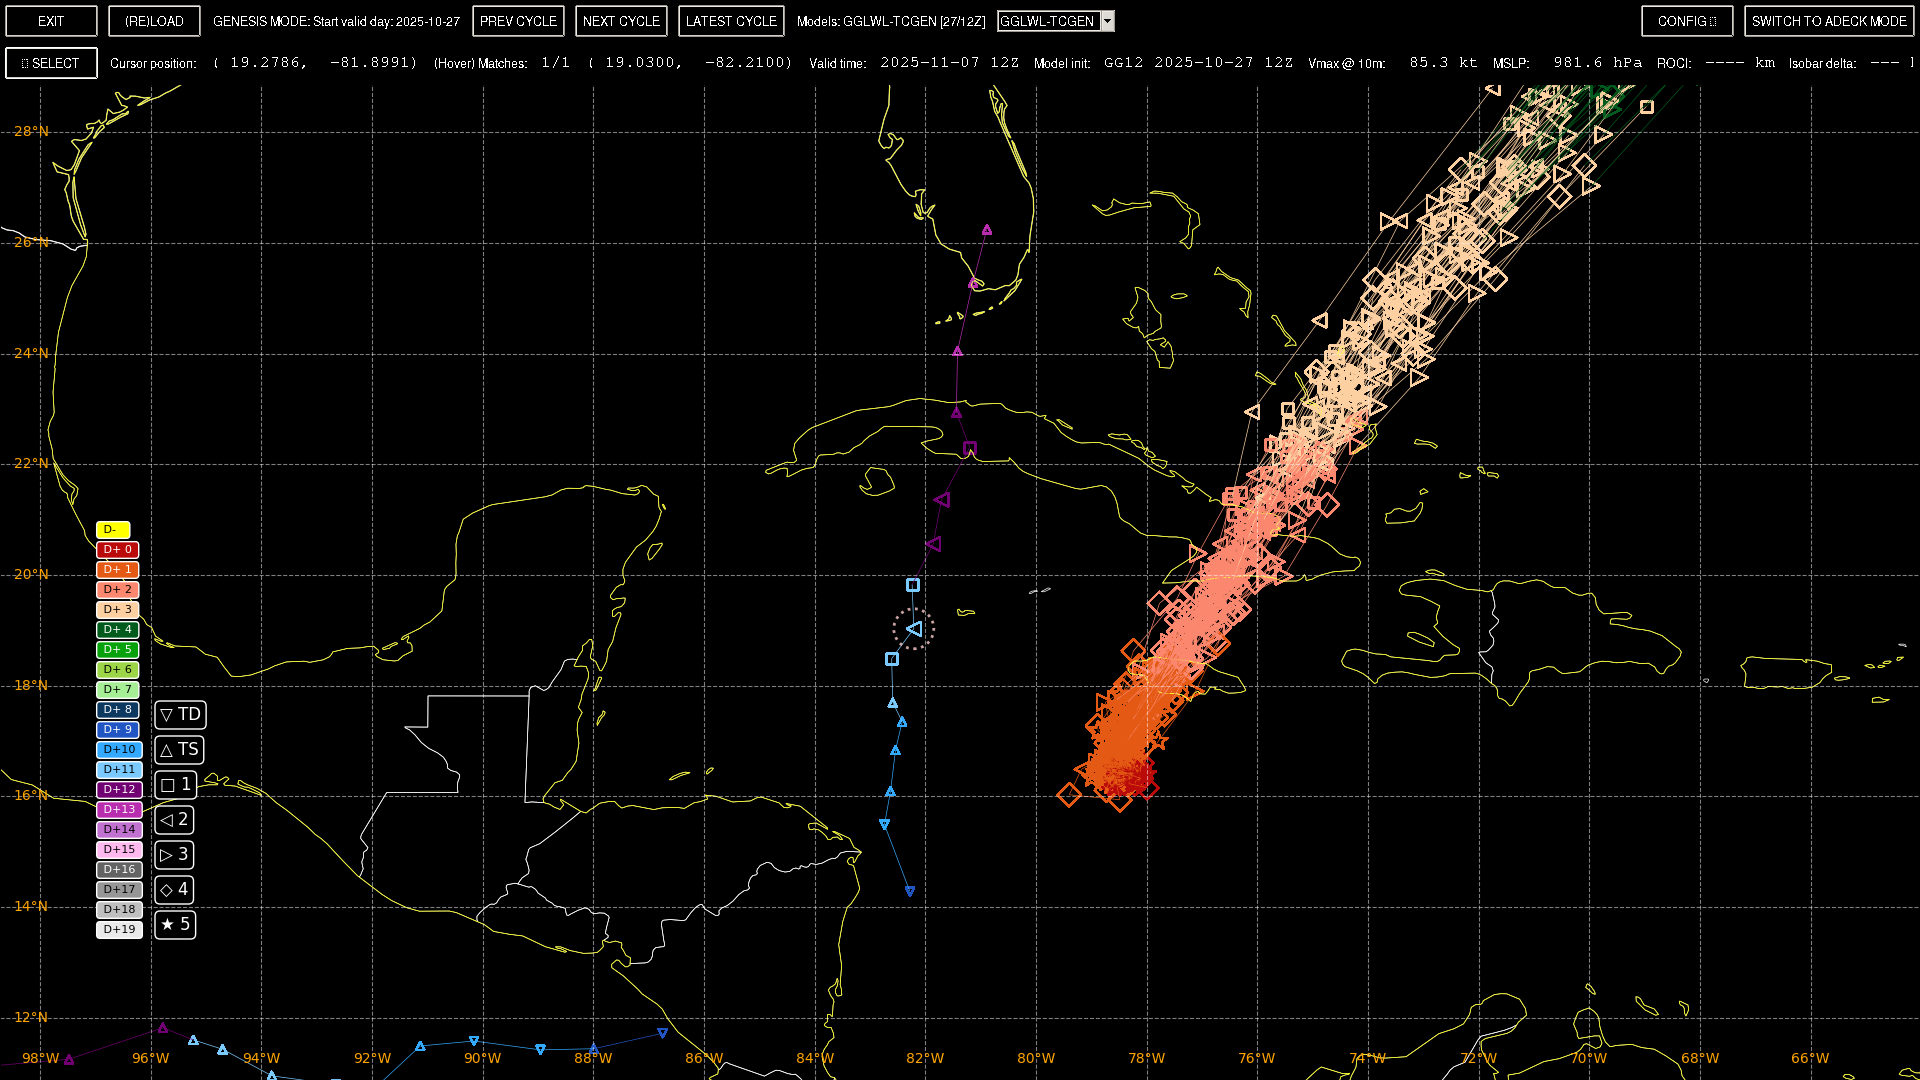
EPS/00Z today (incomplete track for the one indicated);
Past couple runs also show some weak signal...
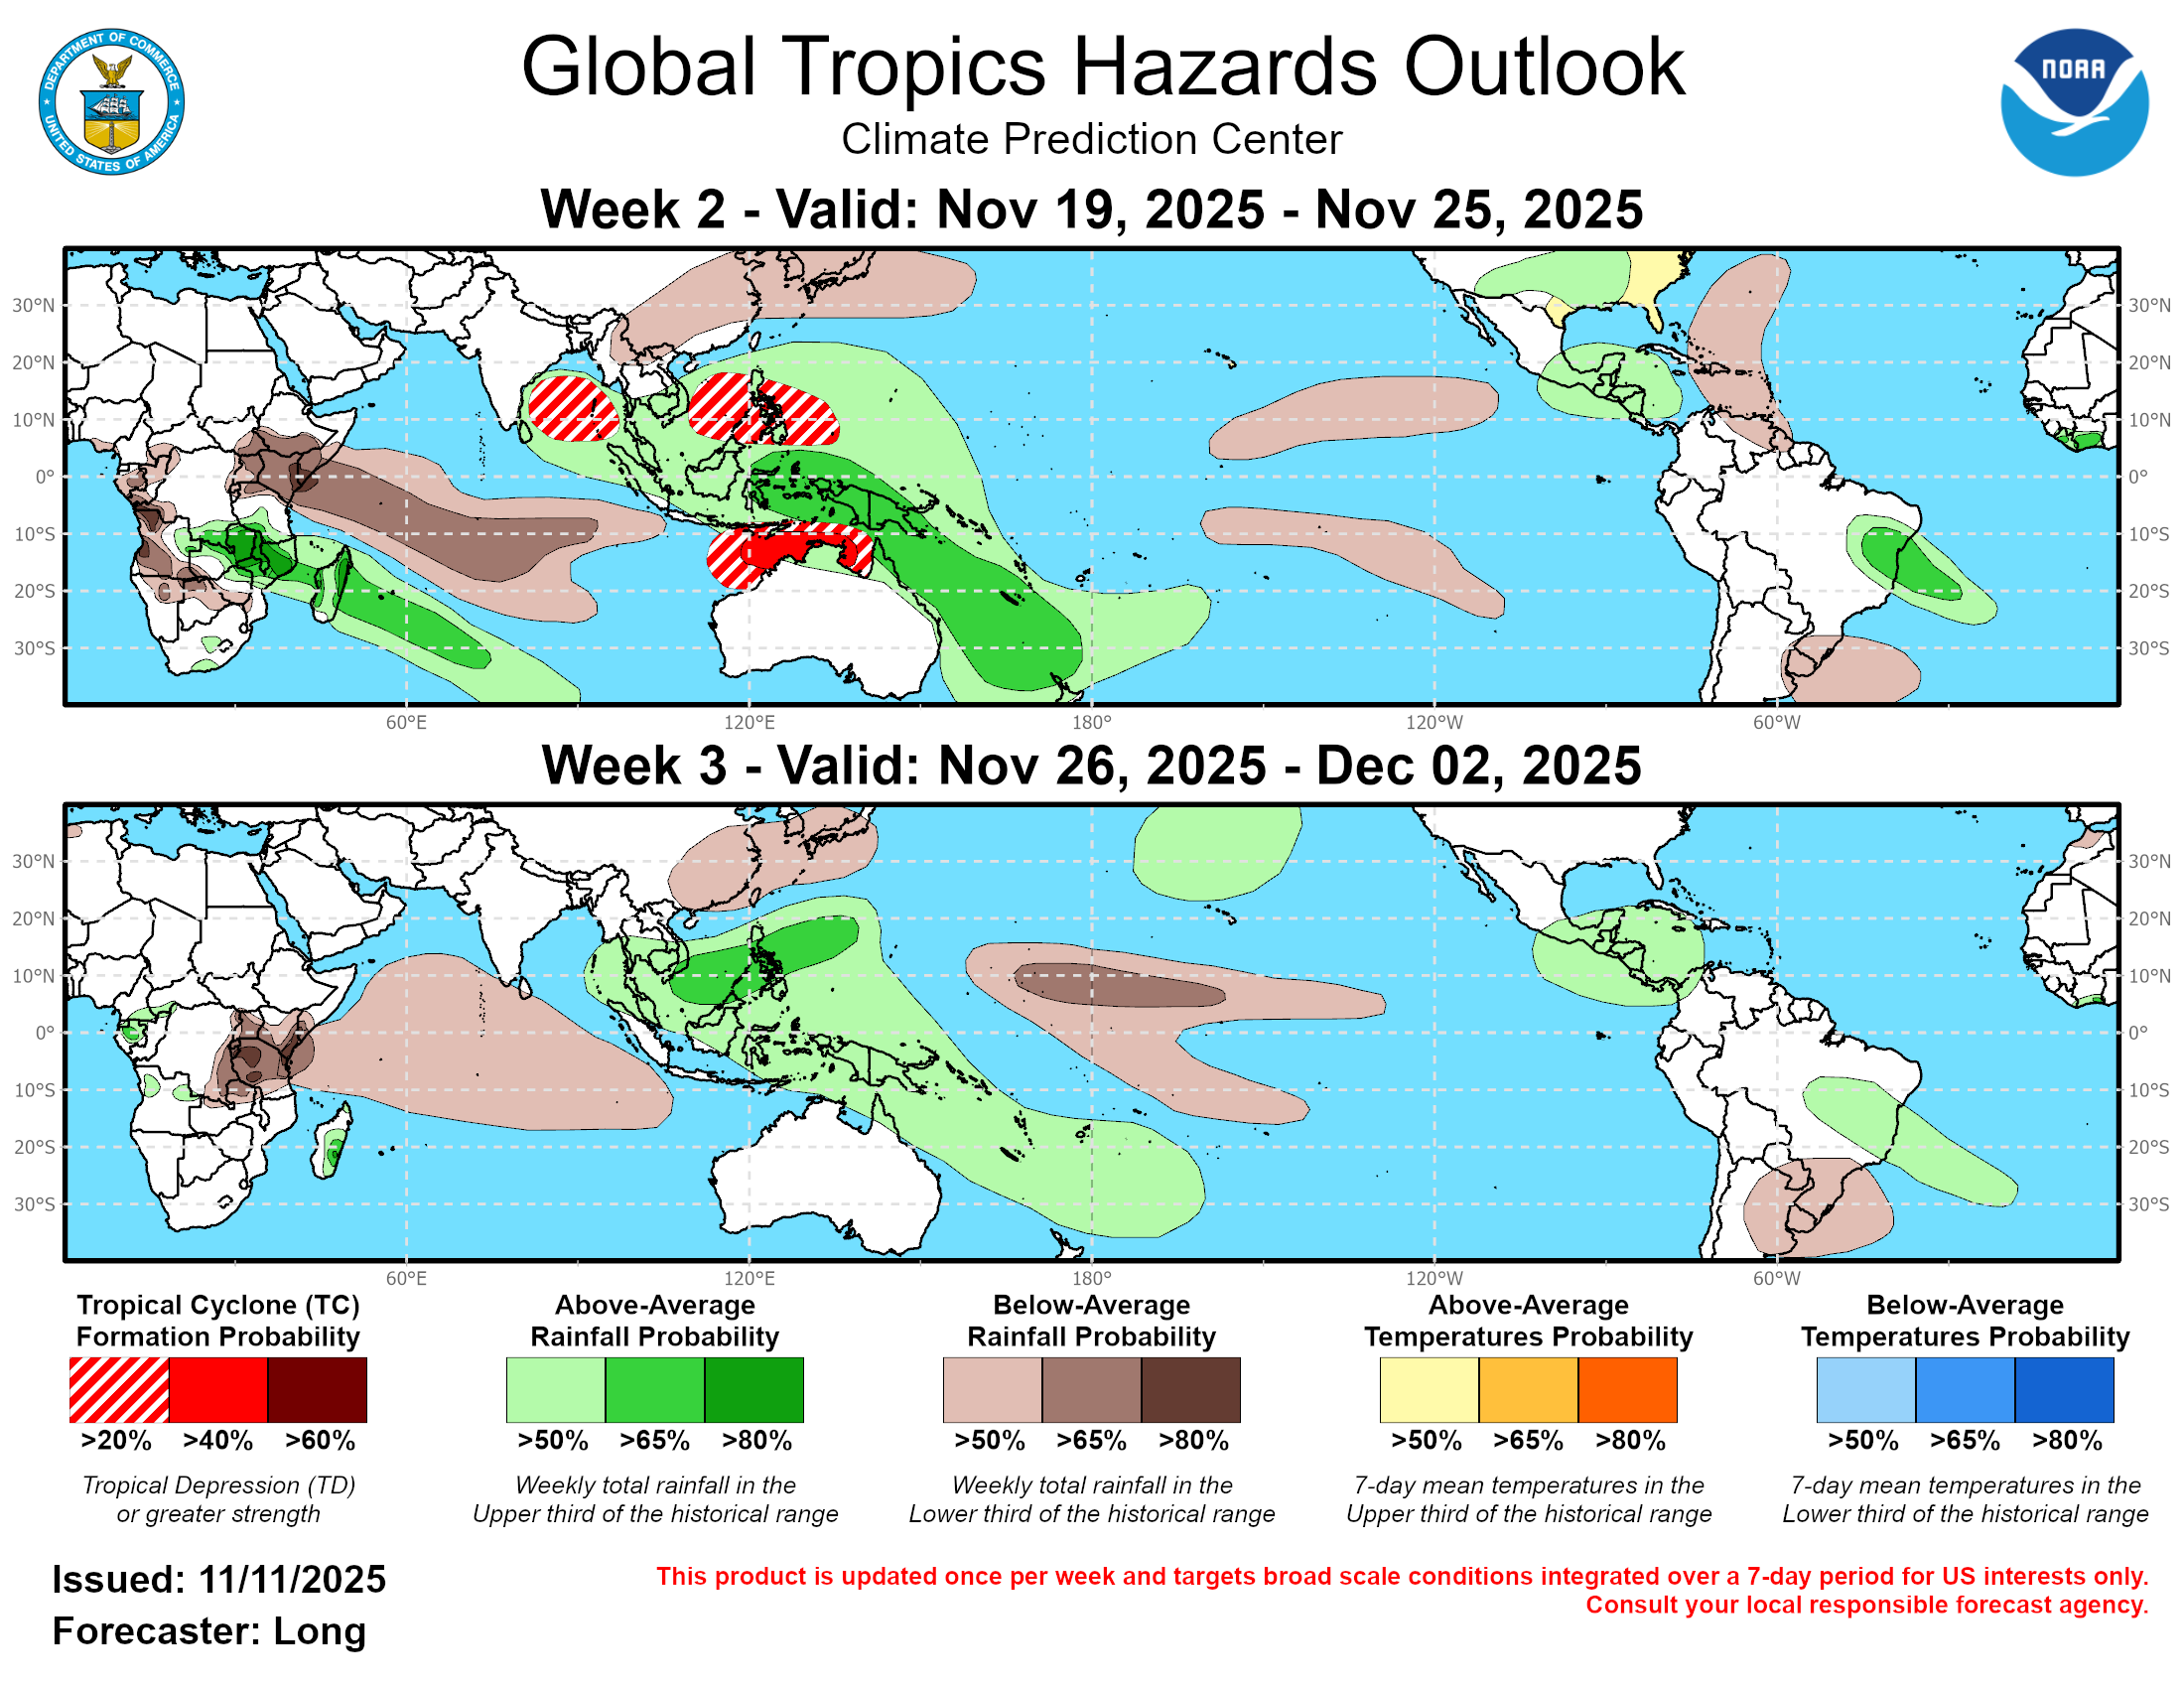
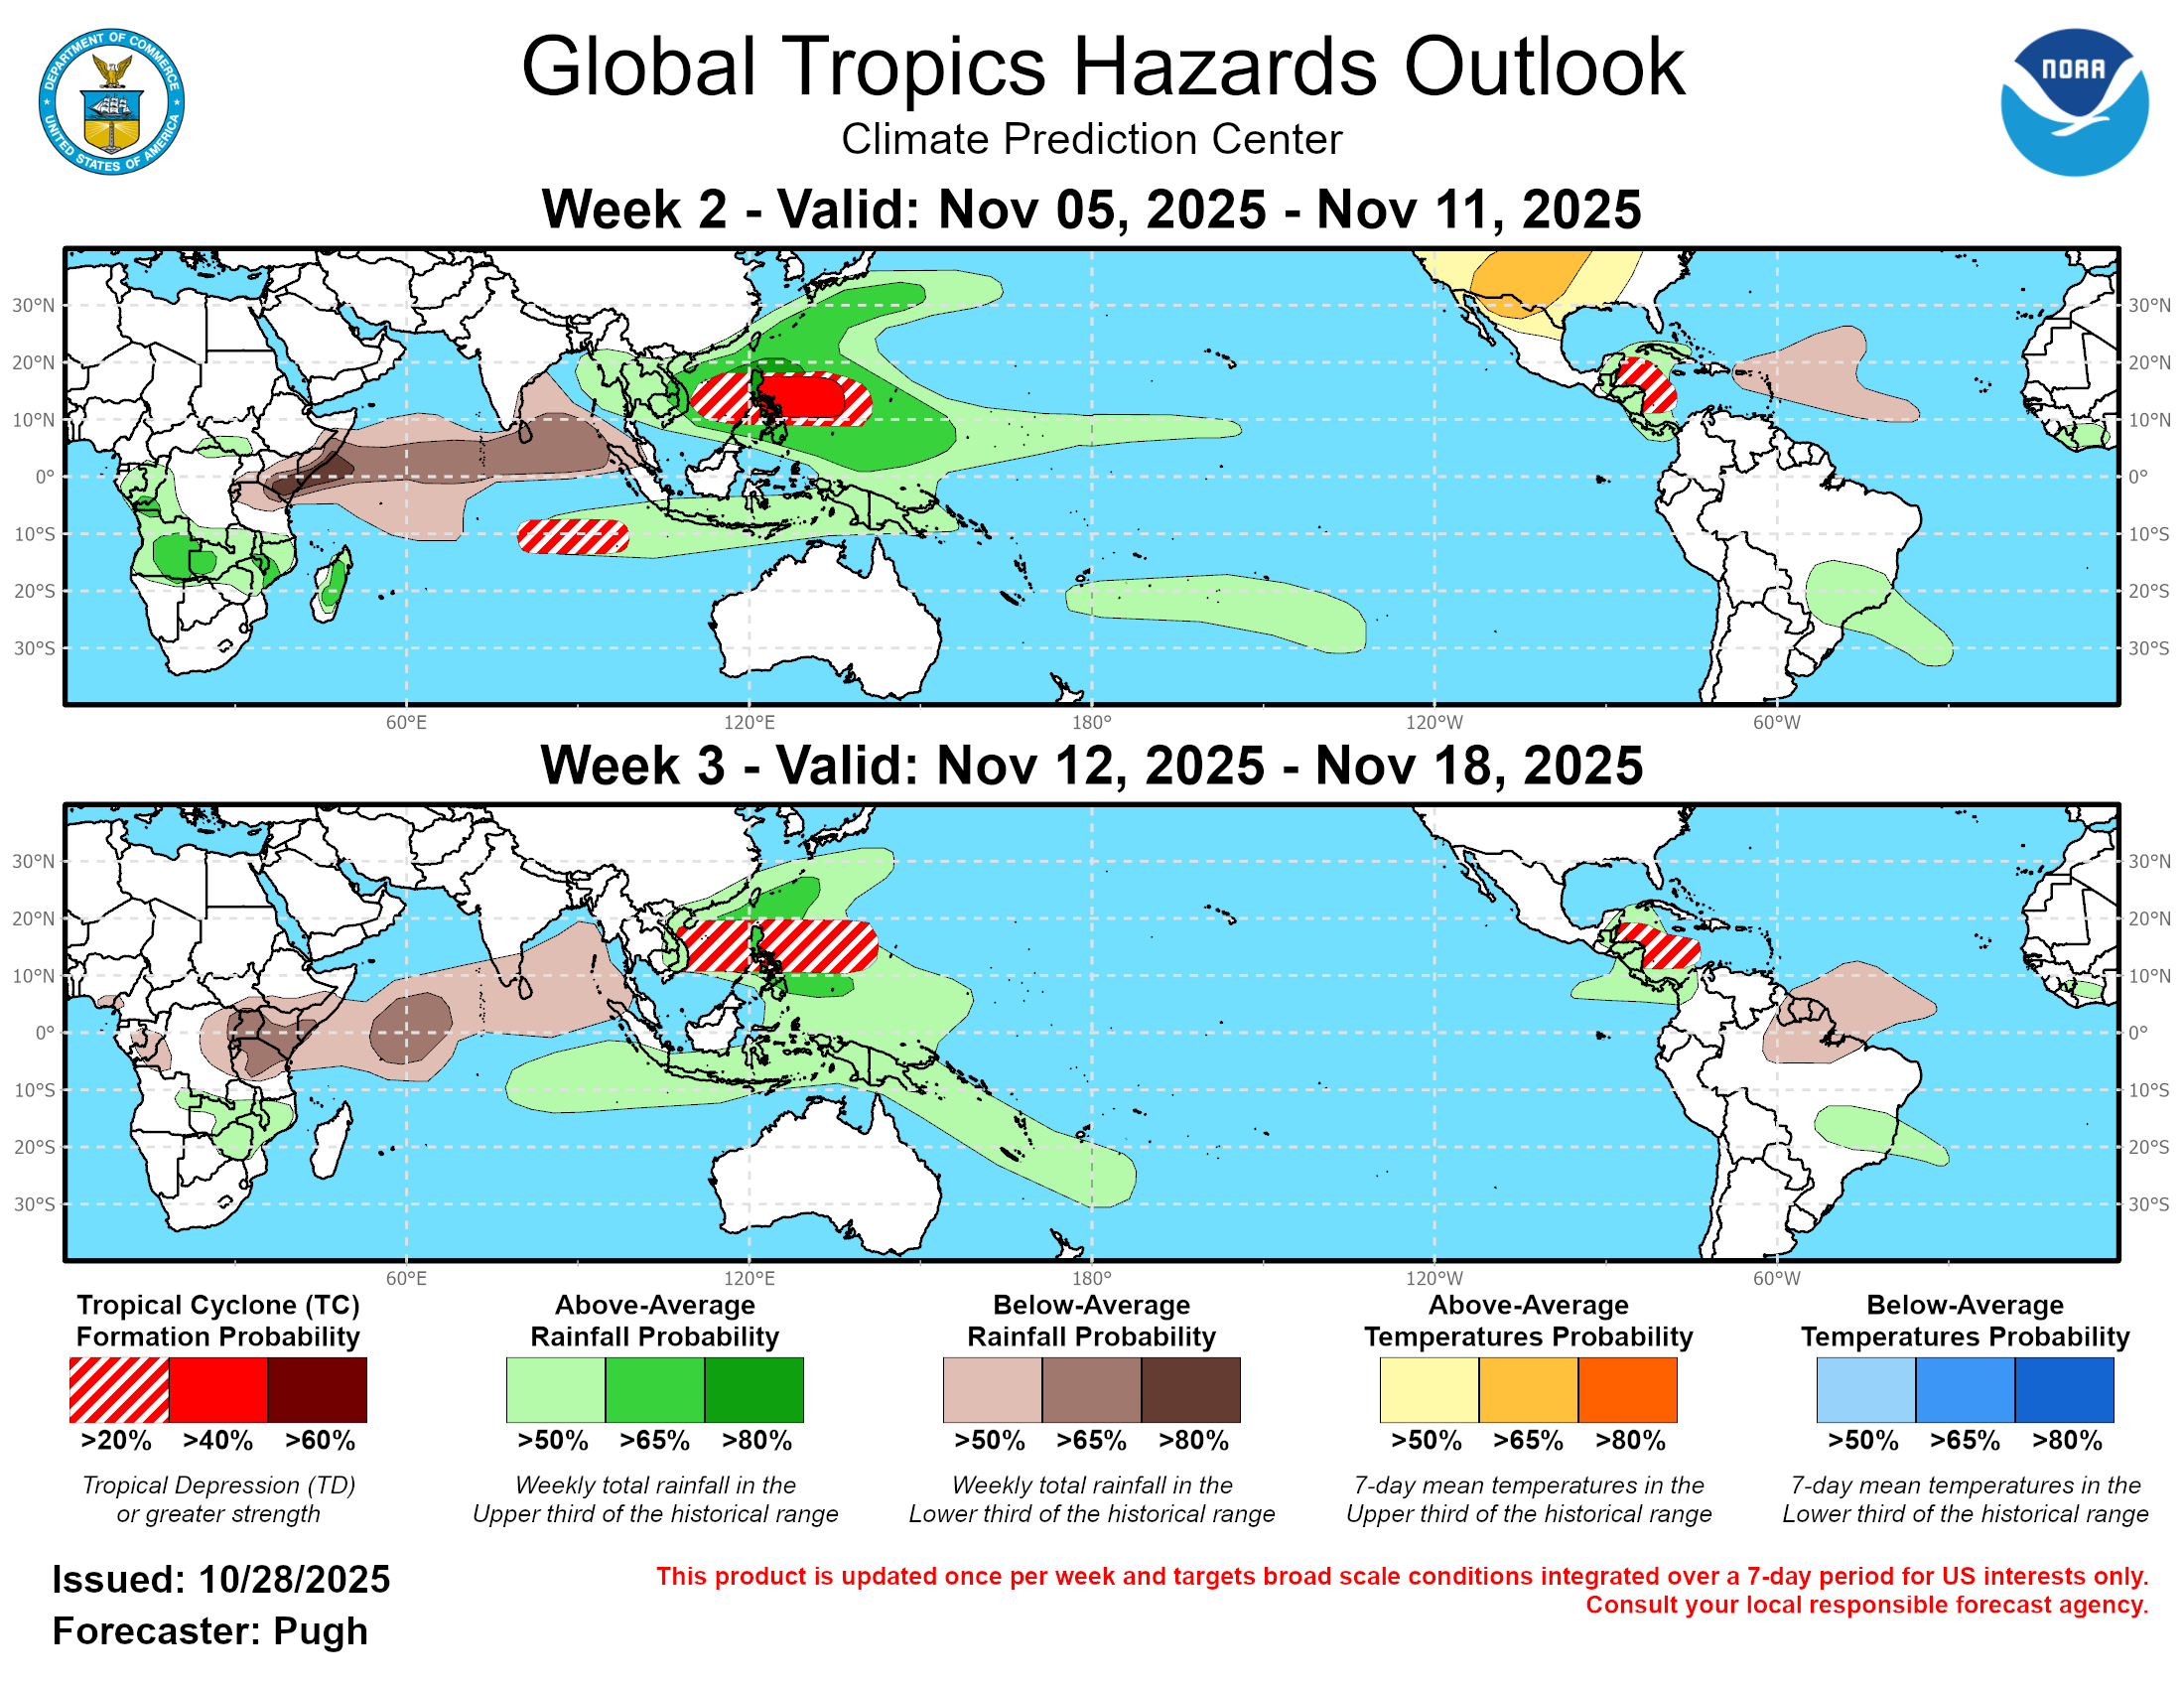
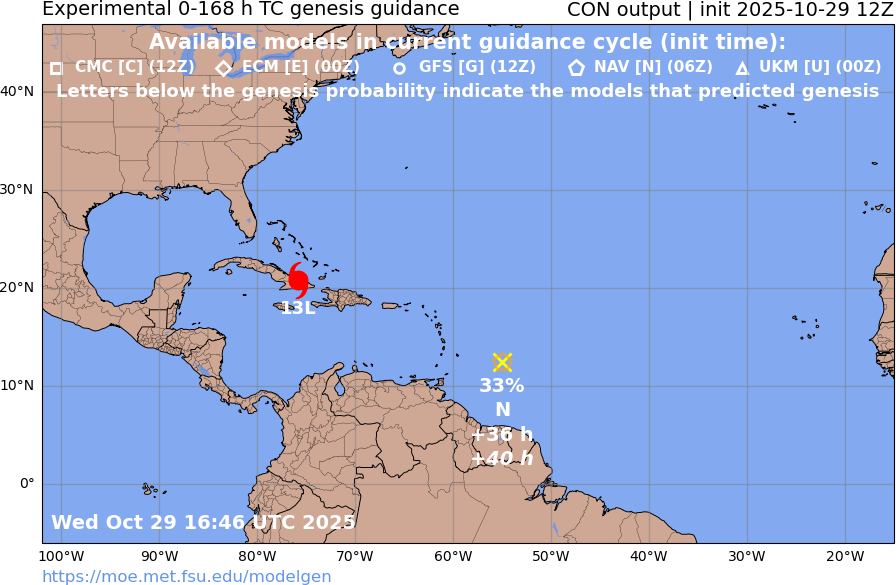
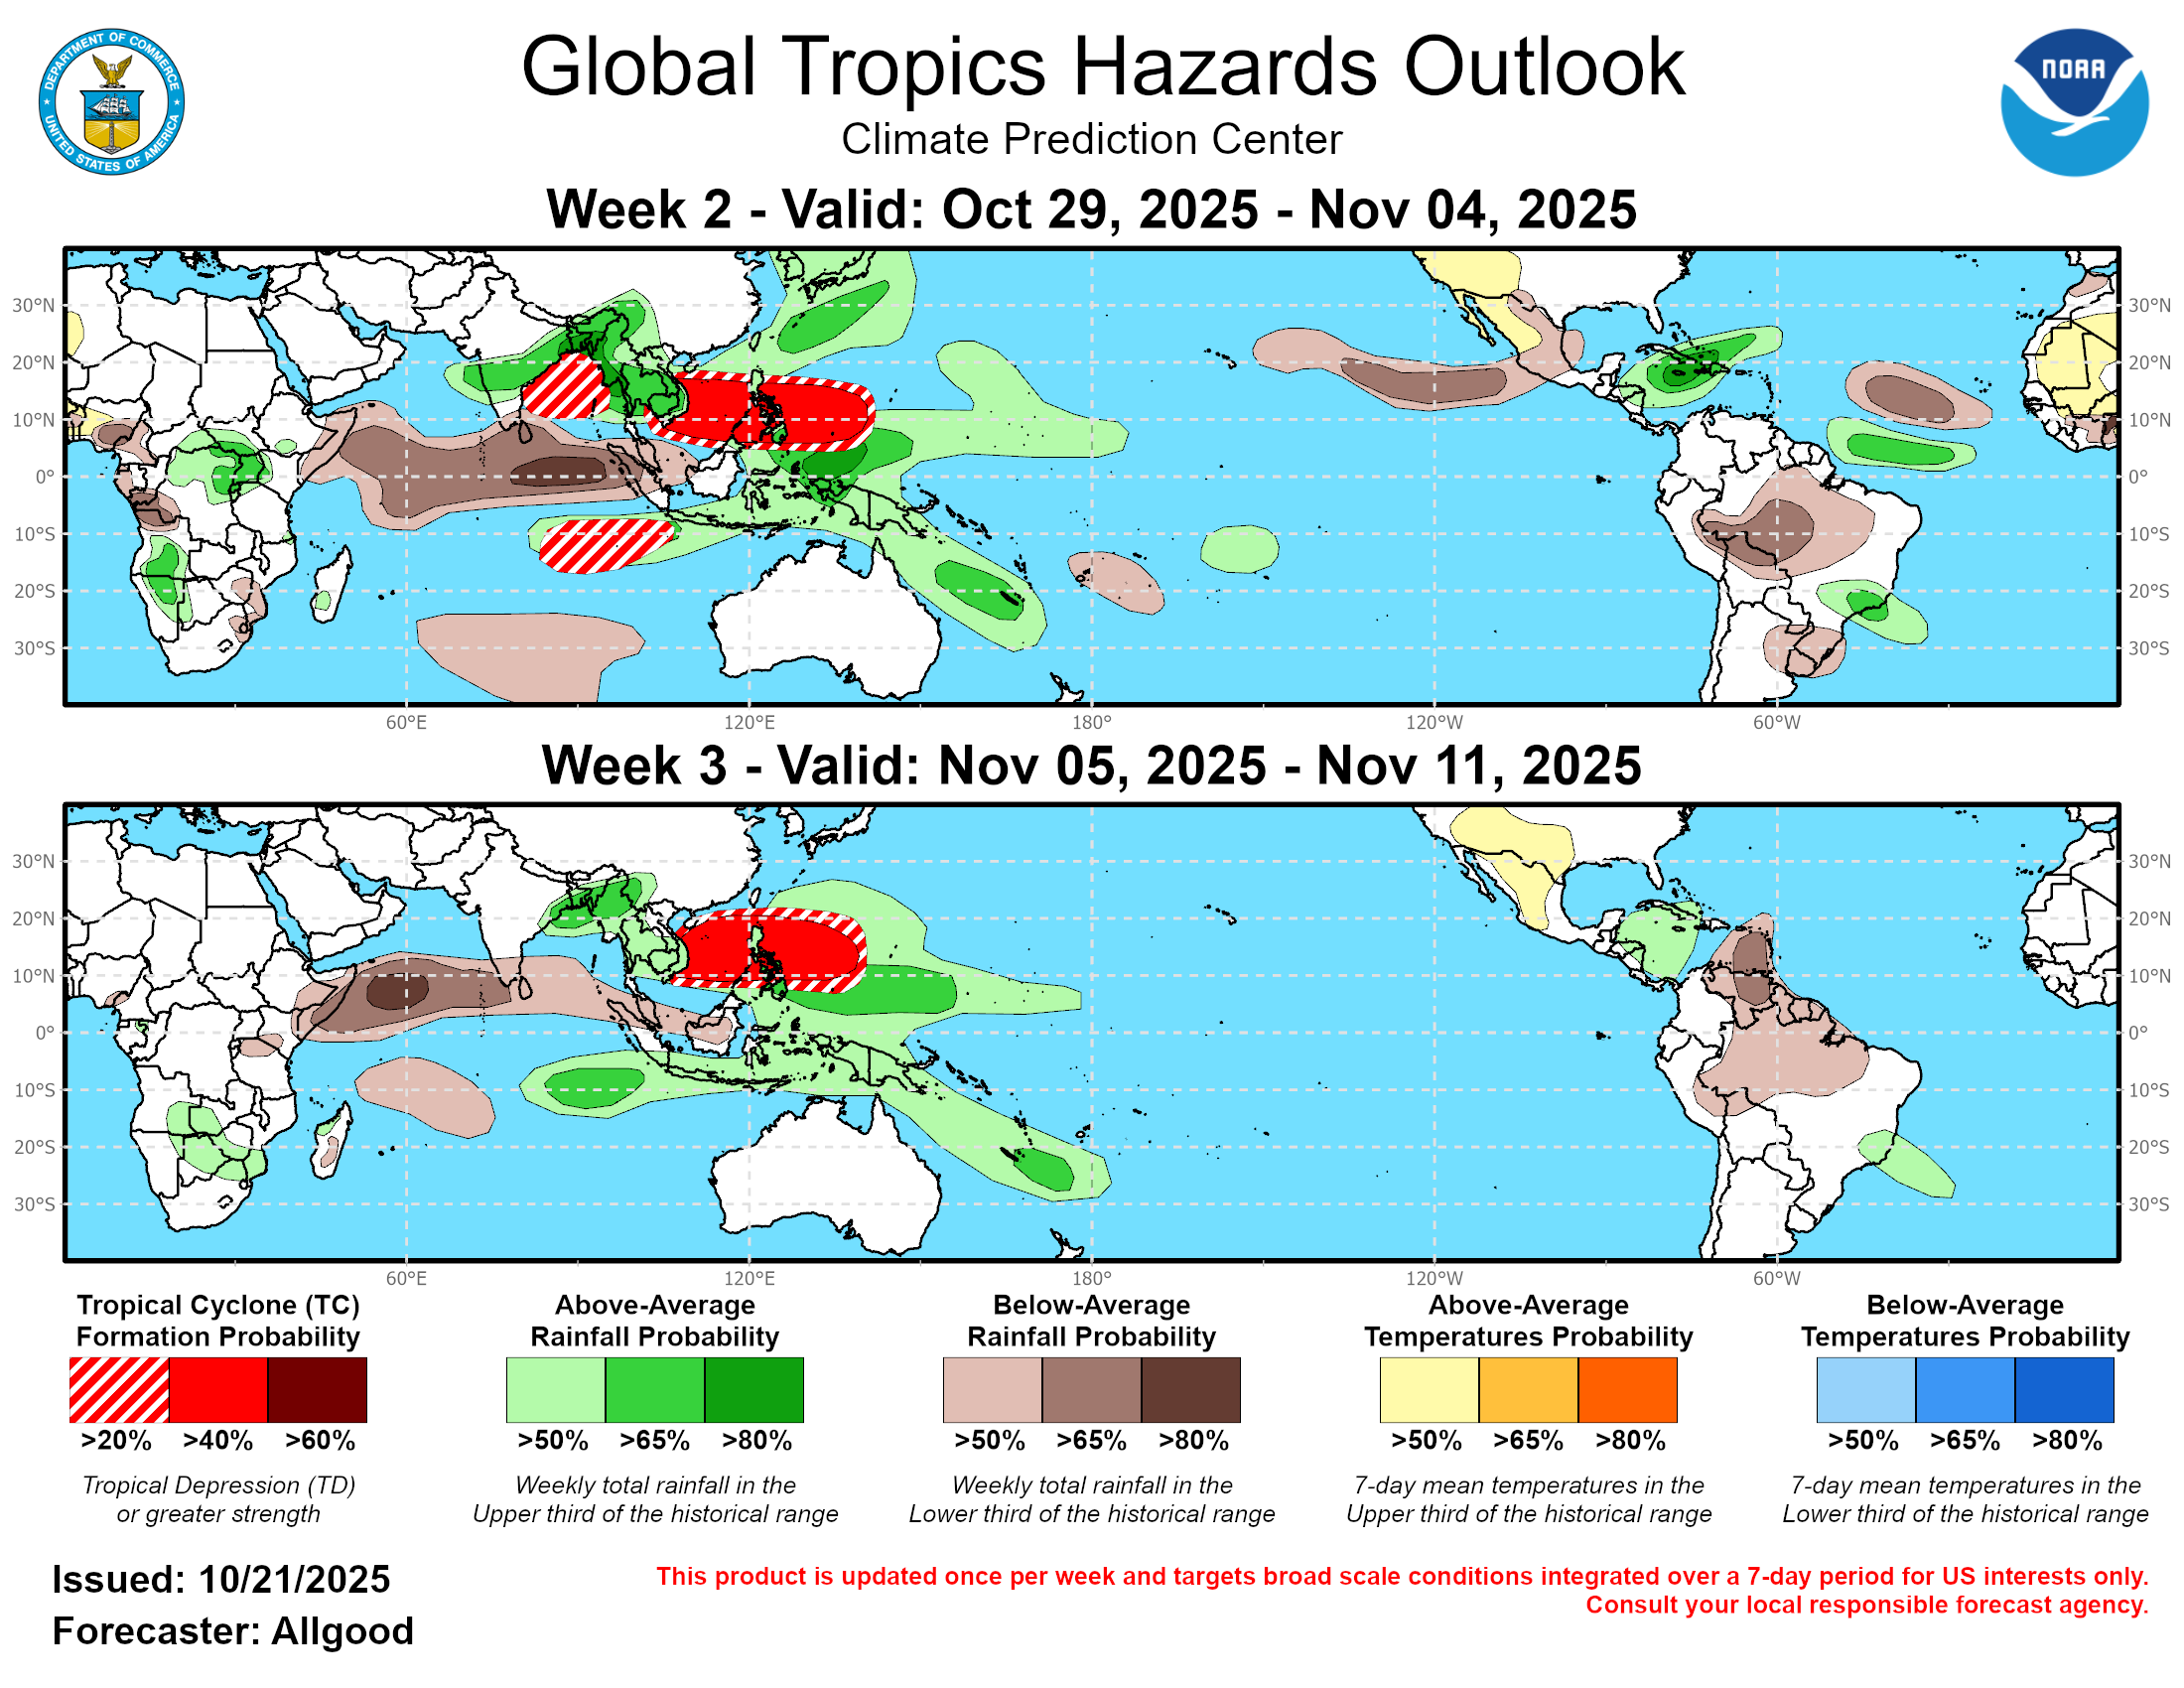
The CPC outlook that came out yesterday has the probability of cyclone genesis for week 2 and 3 in the >20% range (Nov. 5-18). However based on the below the chances for a TS are quite a bit lower (perhaps as low as half)..
There is a tropical wave currently in the central atlantic (west of 40W in the 12Z TAFB surface analysis), that is forecast to arrive near Jamaica around roughly Nov 3 ...
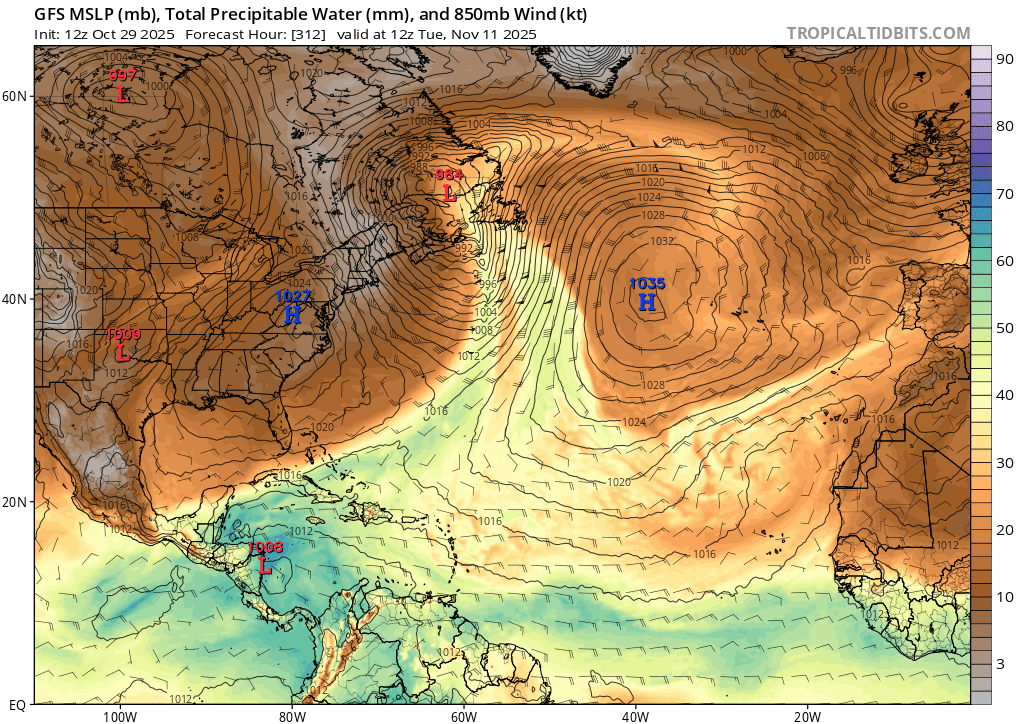
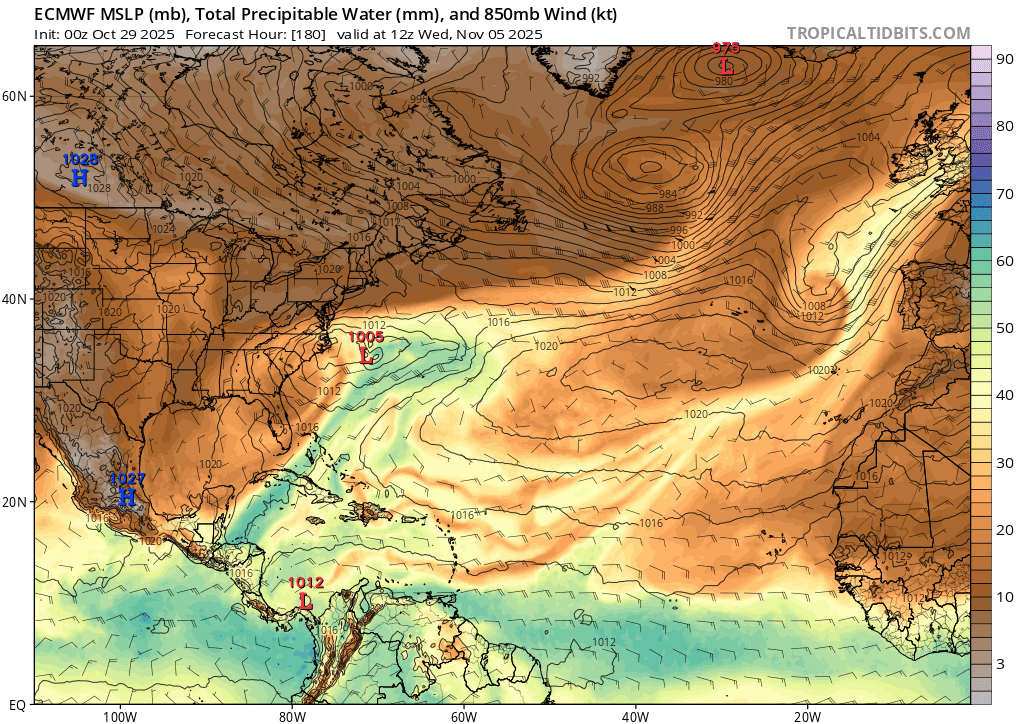
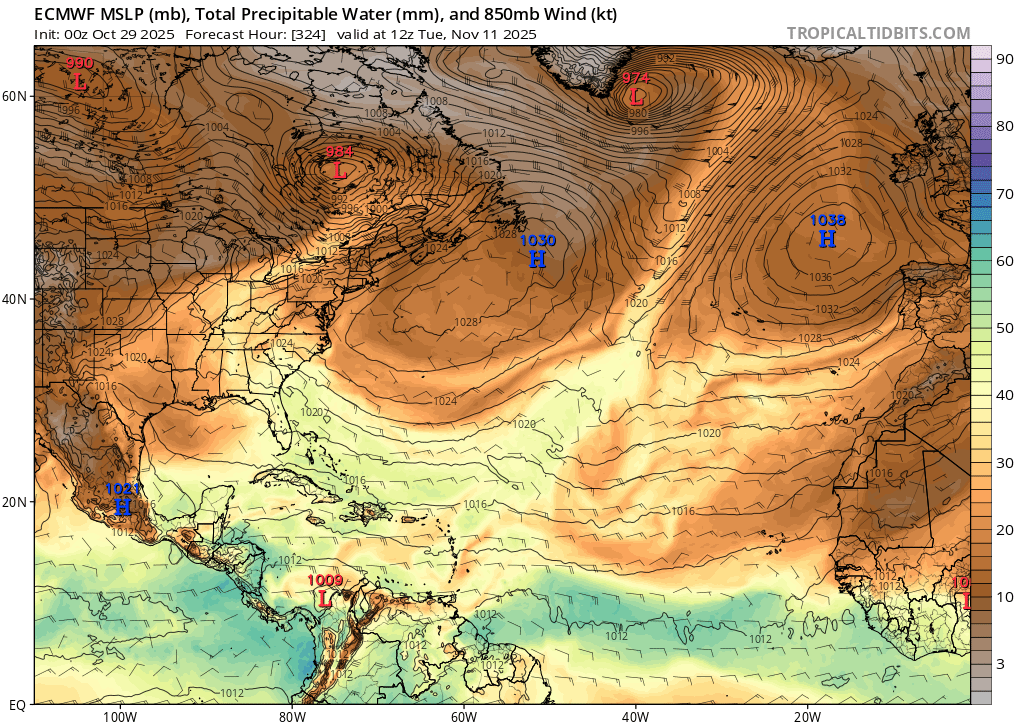
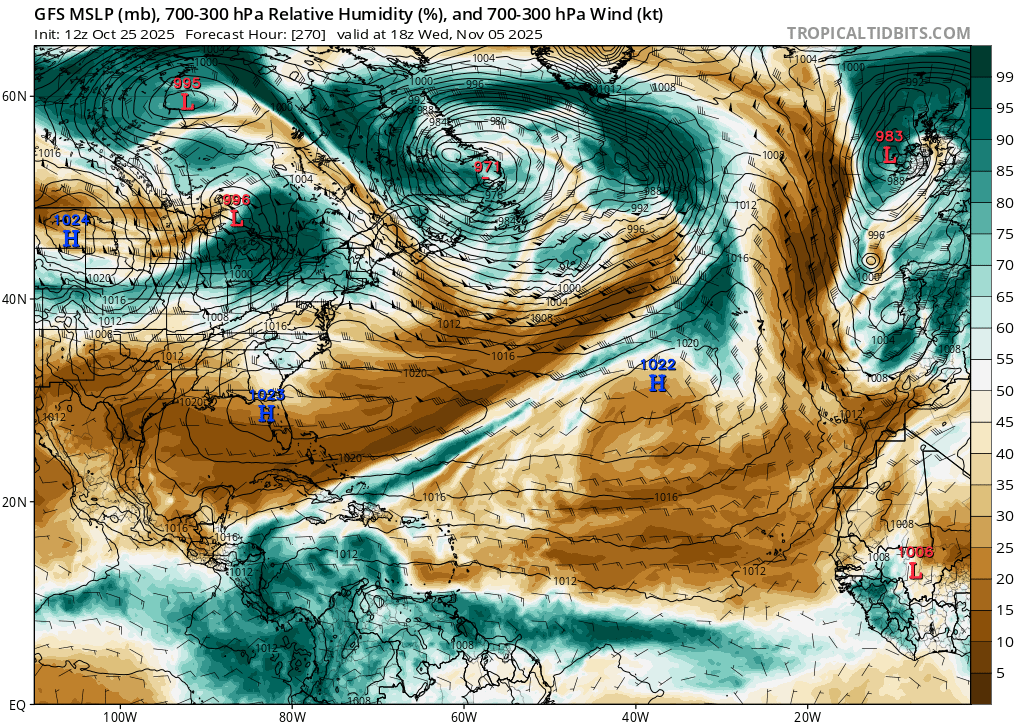
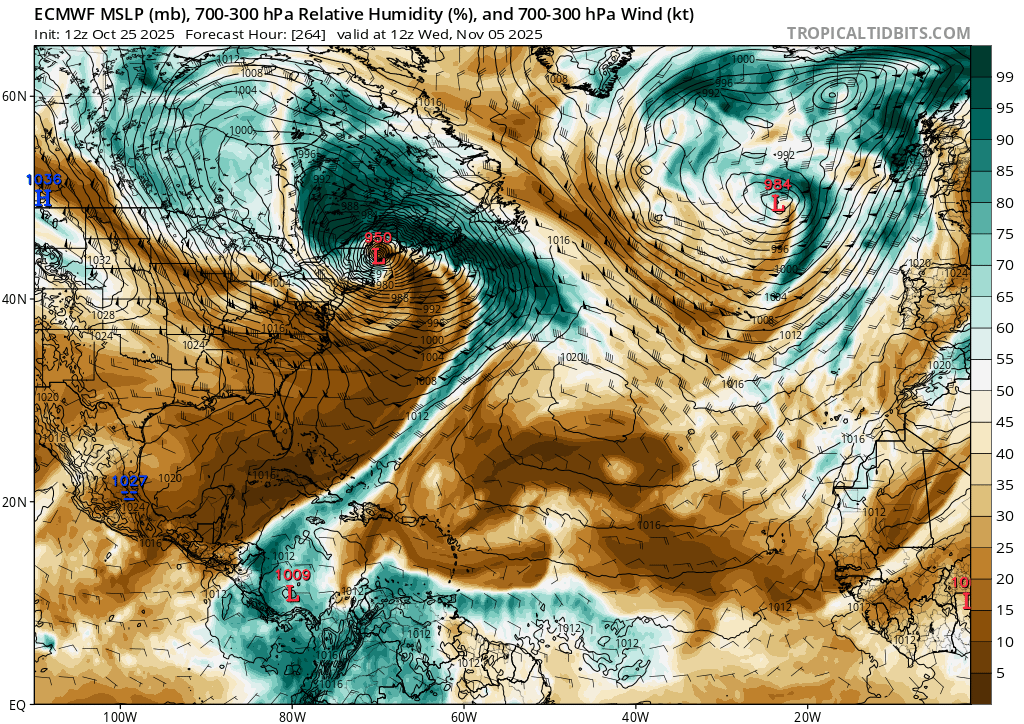
Taking some time to look at recent GFS/12Z (which is more bullish) and ECMWF/00Z (which is bearish), I notice the main diffence in limiting factors is the moisture from synoptic scale conditions through out this periodd.
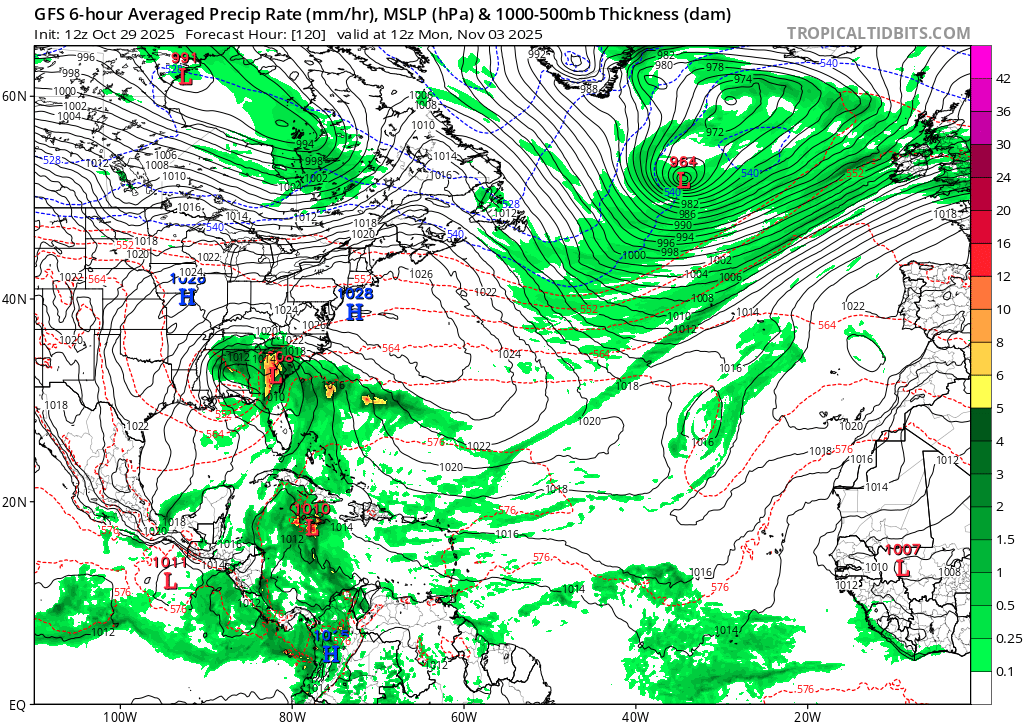
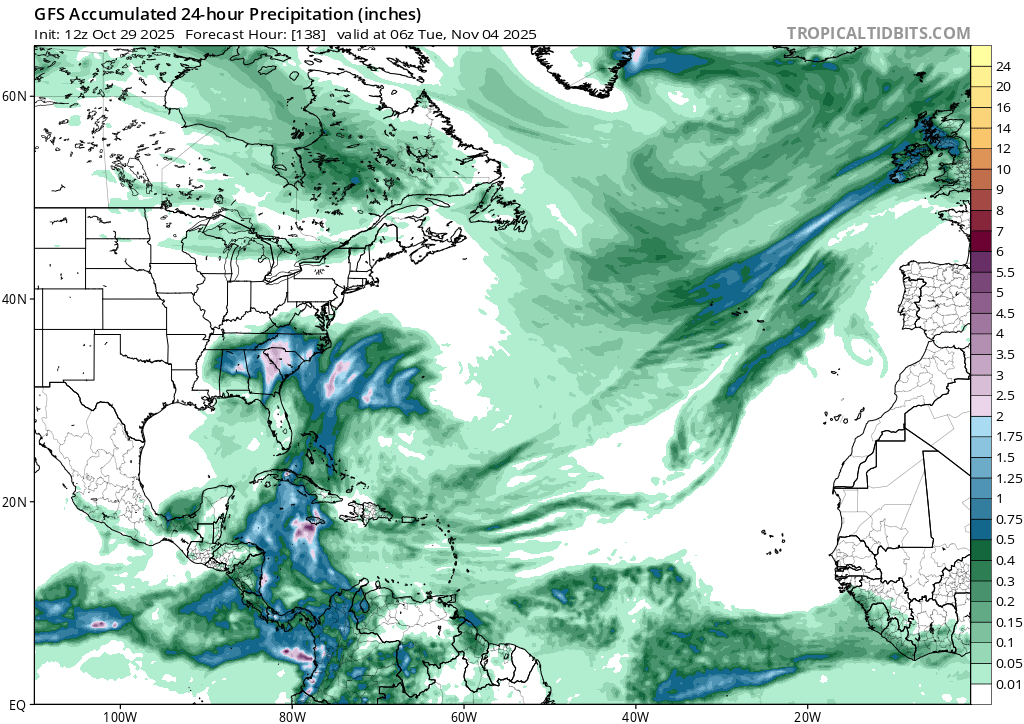
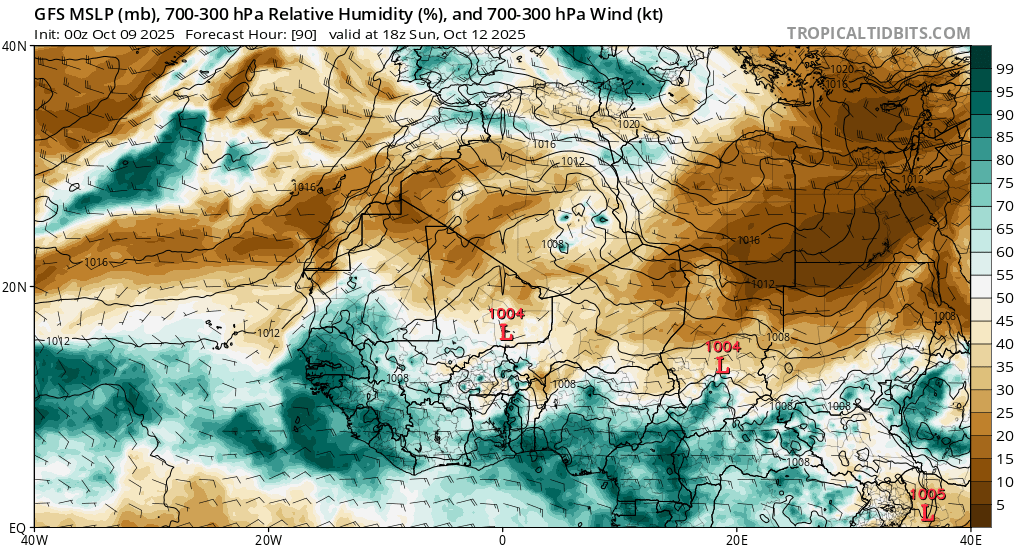
PWAT on Nov 3
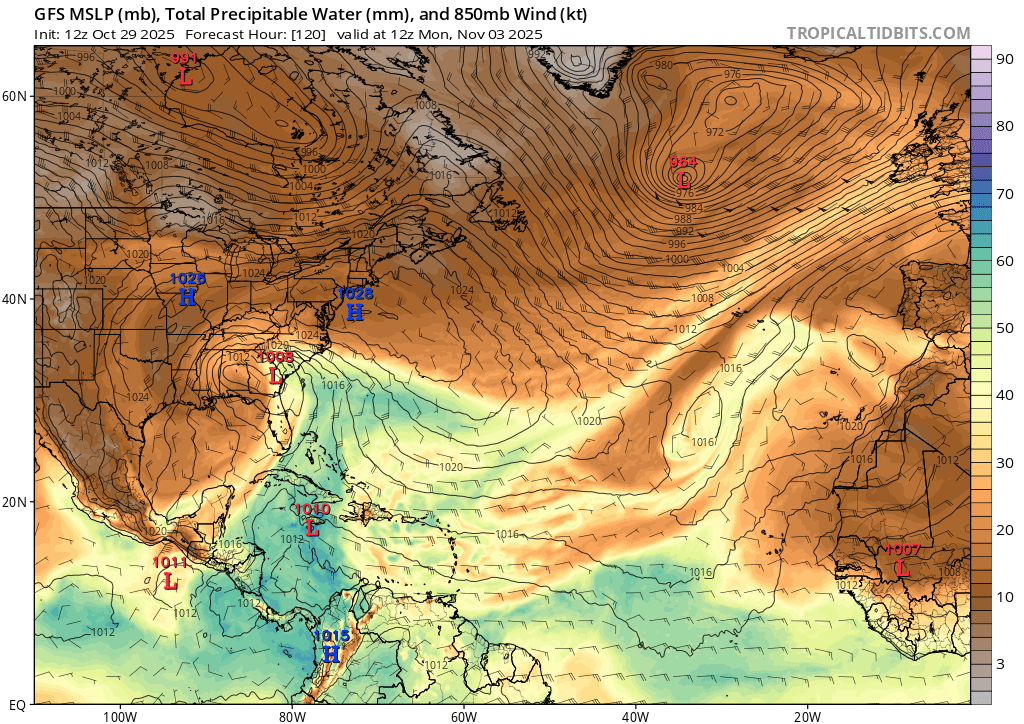
And on Nov 11.
Some more rainfall near/on Jamaica in 5-6 days...
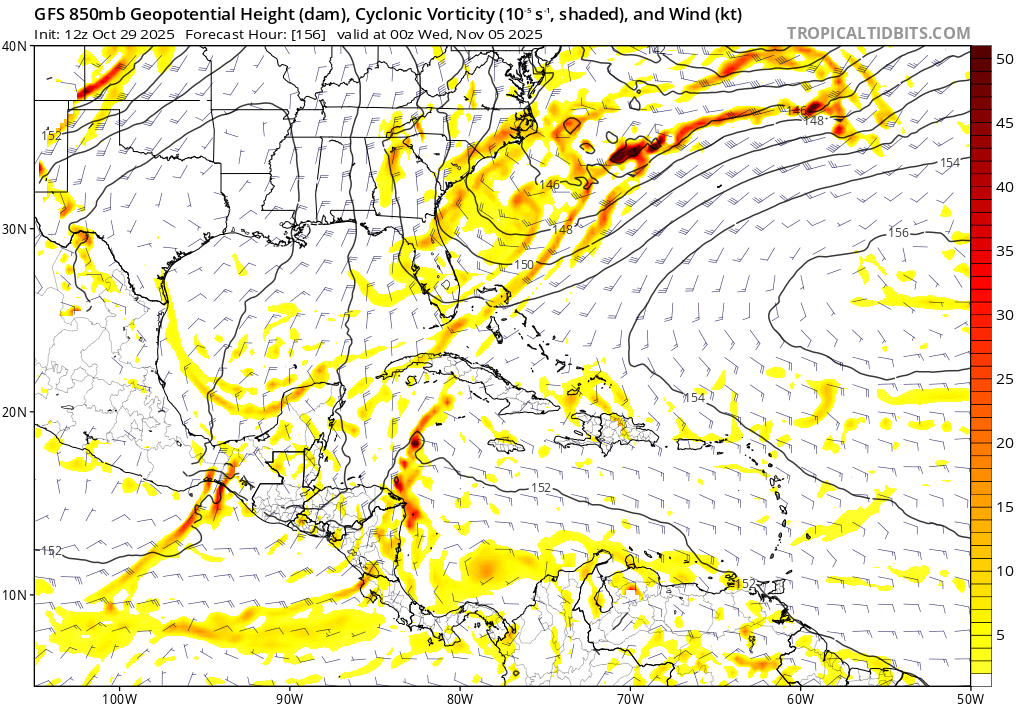
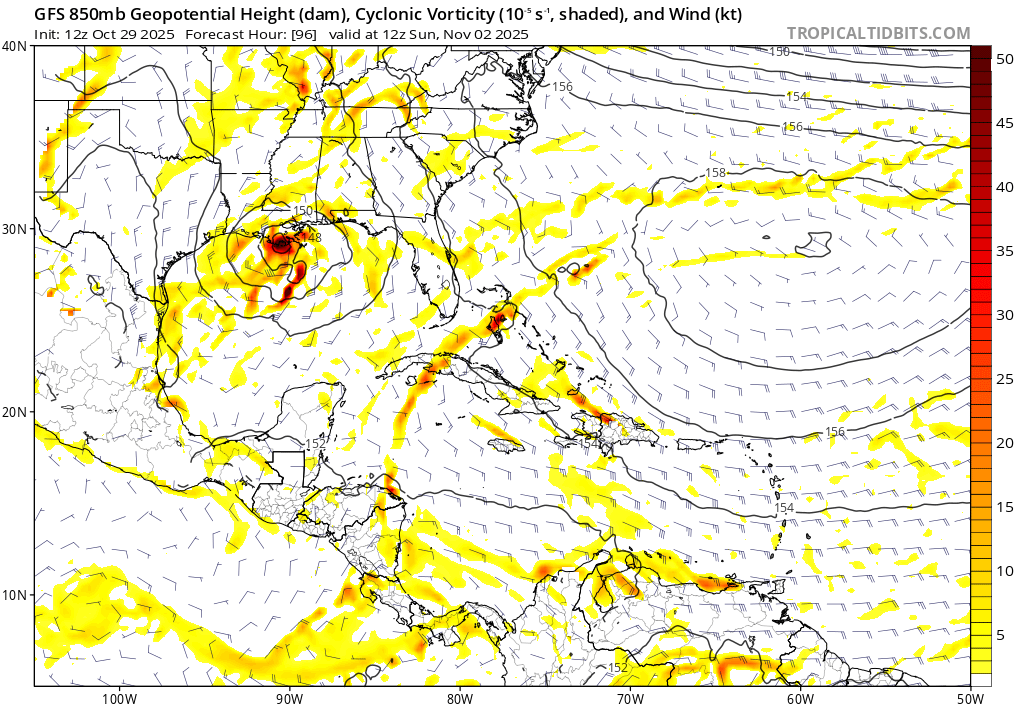
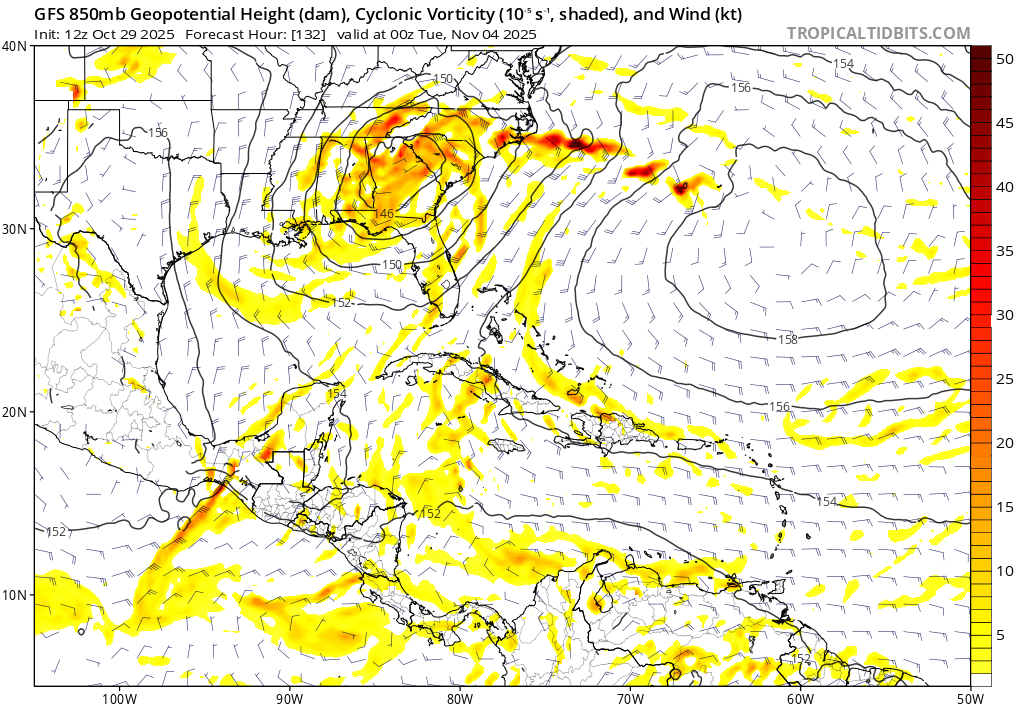
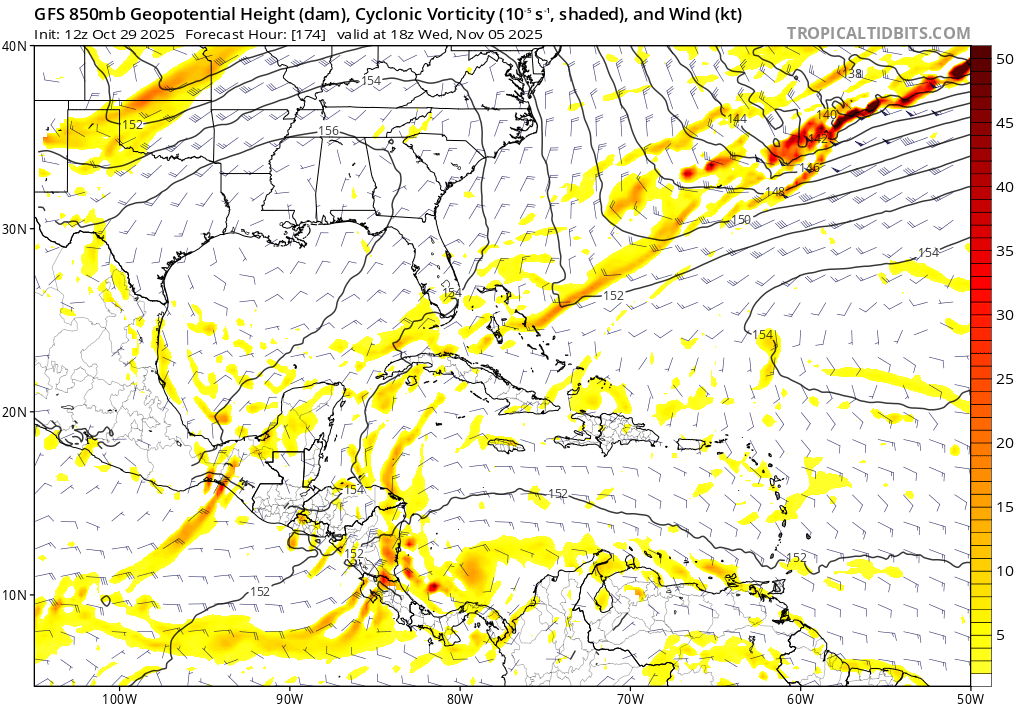
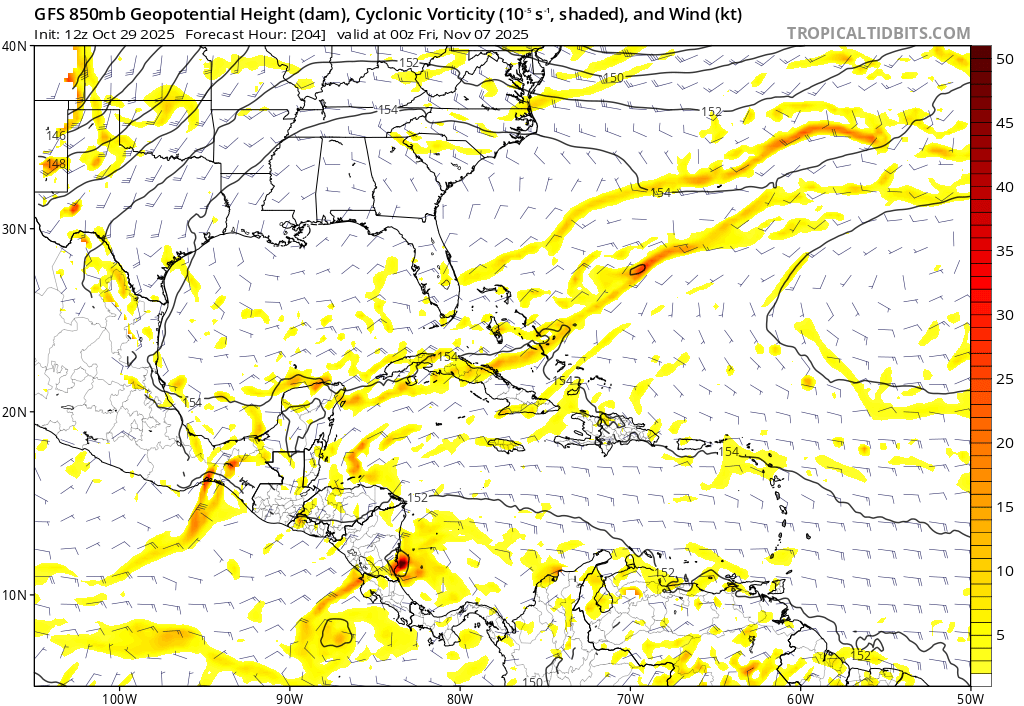
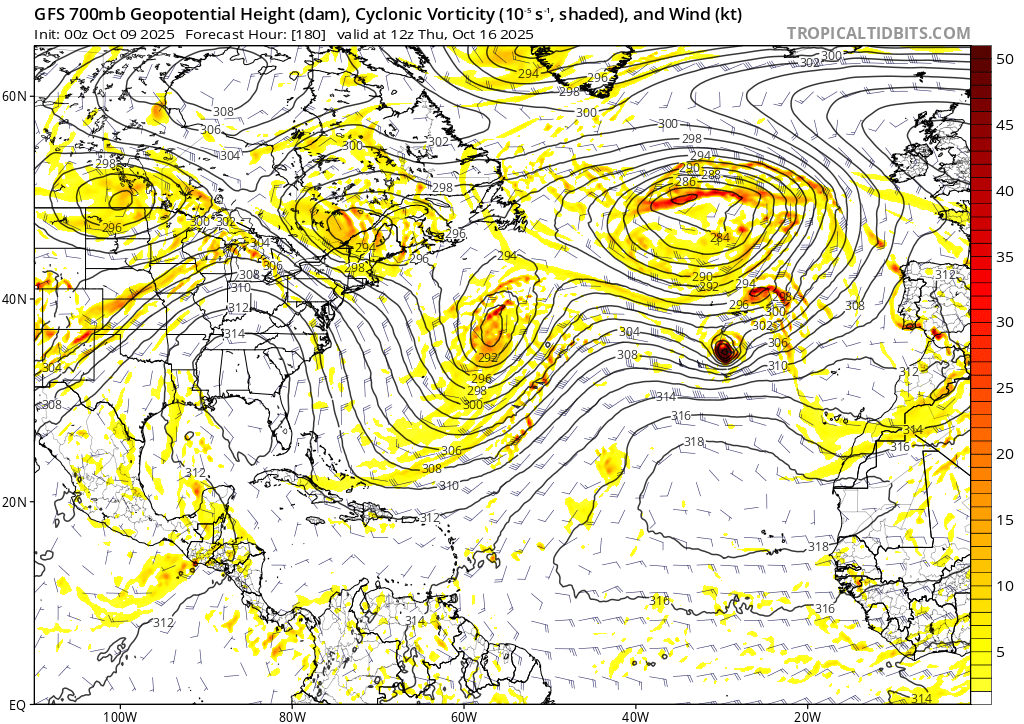
However this wave only directly contributes in one of the possible scenarios painted by GFS, where a vorticity filament follows this and there is a very brief period of spin before it moves over Belize. (generally this fillament from north to south indicates a breakdown of stability along the wave axis and may be why we see some genesis tracks for next week).
A bit earlier on regarding the tropical wave, presently it has some a very compact low-level circulation, and ECM/06Z (but not the last GFS runs) has it persisting as compact until it reaches Hispaniola. This is in contrast with GFS which has it lose its spin and end up tracking further west to provide more rain for Jamaica. ECMWF doesn't show a surface circulation but its possible its too small to resolve. Either way because of the lack of the surface circulation ist doesn't look likely to become a TC. GEFS/12Z did have two of its members (5%) becoming a TC in this scenario (one a weak TS, the other a hurricane --intensifying after starting recurve after crossing Puerto Rico).
More generally looking at the 12Z ensembles for the region, most of the probability of GEFS/12Z is given in the next week (25% of a TS including all the different scenarios in the Caribbean and the above one I just mentioned before the 8th) and 10% of a TS for ~ the subsequent week (genesis around the 8th) as far as the genesis tracks go.
GEPS/12Z has the reverse for the different periods (up to 38% total).
Next looking at EPS/12Z it indicates lower chances for development through the next 10 days than GEFS (38% for a TC, and 13% a TS) -- following the below analysis this indicates mostly a poorer environment in terms of dry air (and the steering provided not giving them enough space and time to develop as they hug the coast). Note that this doesn't cover the same extended period as GEFS/GEPS/Google so it doesn't have anything to say on past the 08/12Z
However I generally consider the GEFS/GEPS as weak signals (even without discounting them being further out) despite the CDF for a TS being in the 35-40% range for GEFS, GEPS, as they haven't narrowed down on a particular scenario. Considering Google/12Z shows nothing its 14 day window the CPC prediction of >20% for week 2 seems to more correspond to chances for a TD and much lower chances for a TS (subjective I am used to 80-90% a TD becomes a TS over the open ocean but given the limited space a much lower % makes sense also in the geographically+temporally constrained development environment).
FNMOC deterministic is very bullish about the wave developing...
Taking the usual superensemble (GEFS/GEPS/EPS/FNMOC/GOOGLE 12Z ensembles) (FNMOC ensemble is a very bullish outlier at almost 30% a TS in the next 3 days -- and as such I generally discount scenarios such as this when none of the other models agree as in this case -- as in the FSU det product).
I don't consider any regions such as the subtropics as the tracks there all appear to be not TCs (phase analysis shows nearly nil chances of a TC), so generally subset as usual on places where there seems to be a legitimate signal (some agreement among ensembles) as shown in the highlighted region which I estimate the chances of a TS in the next 10 days to be roughly 10%, and overall in the next couple weeks and beyond to be necessarily higher cumulatively (the super ensemble gives 23%, but is likely an underestimate with EPS missing for the extended window and this is going to be more uncertain for the usual reasons and that its not calculated precisely due to the different forecast windows)...
Given that Google has no signal though to 14 days and for the prior reasons about FNMOC ensemble being too bullish, I discount it perhaps 20% for the next ~ two weeks (i.e. through week 2 in CPC). Through week 3 (as in the CPC outlookk) it is more uncertain but based on the NCICS it should be much lower.
The justification as such is based in part on the below ...
Last CIMSS vorticity analysis showing the circulation with the tropical wave near 45W now...
Indirectly though its possible the wave may rather precondition the mesoscale environment to be a bit moister based on the timing for any Nov 5-8 genesis between Nicaragua (originating W, NW of Colombia).
More broadly during this 2 week period the synoptic scenario painted by ECMWF is different and has more dry air appearing to come from the Atlantic in general through this two week period; there is not much more I can say regarding this negative contribution..
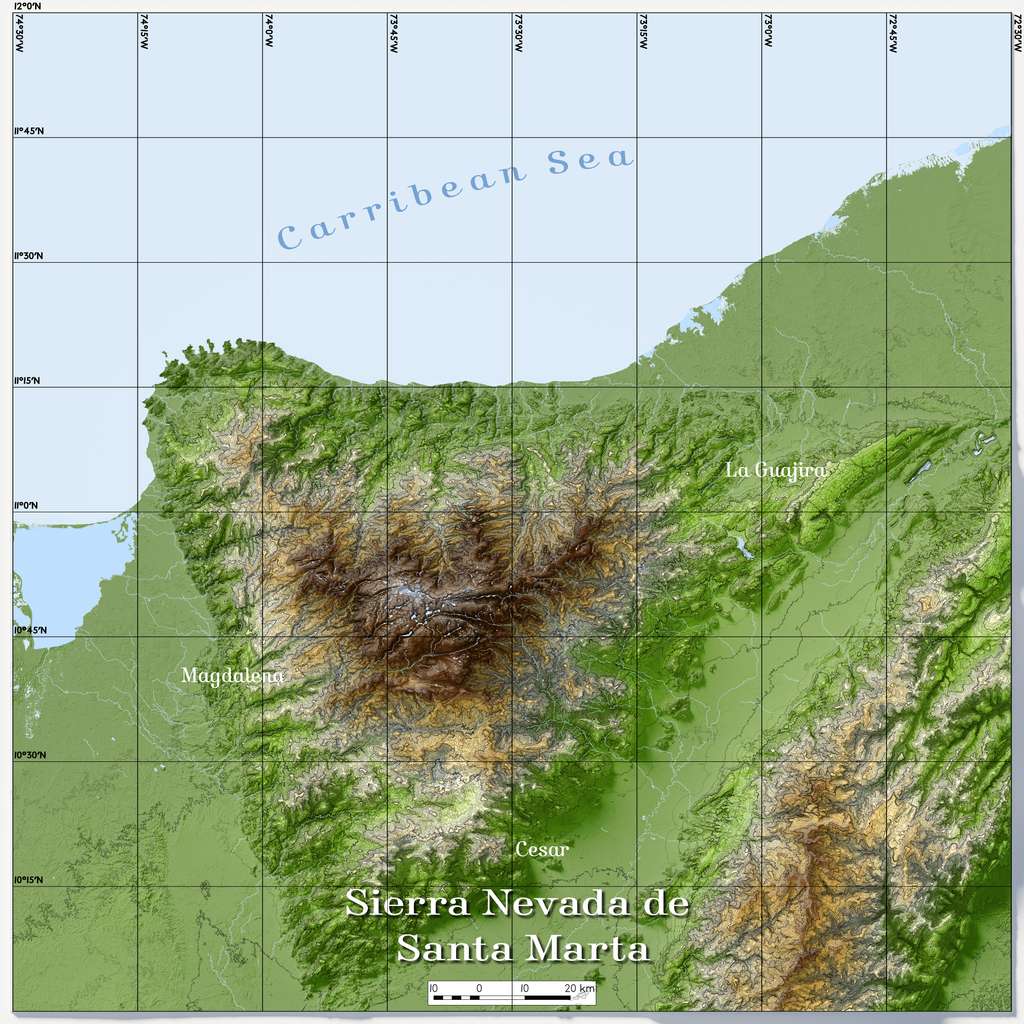
However, one of the reasons for genesis that both models appear to agree on in these runs is that trade winds + lee vorticity from Colombia will be a contributor to most possible genesis events in the next couple weeks or so (originating specifically from Sierra Nevada de Santa Marta).
In both the model runs you can observe repeated lee-vorticity spawning from there during this 2 week period that generally end up contributing to any spin WNW)
In the below scenario next week it happens twice in consecutive days, and they end up merging before tracking west and possibly merging with the larger vorticity filament generated by the tropical wave as it breaks down.
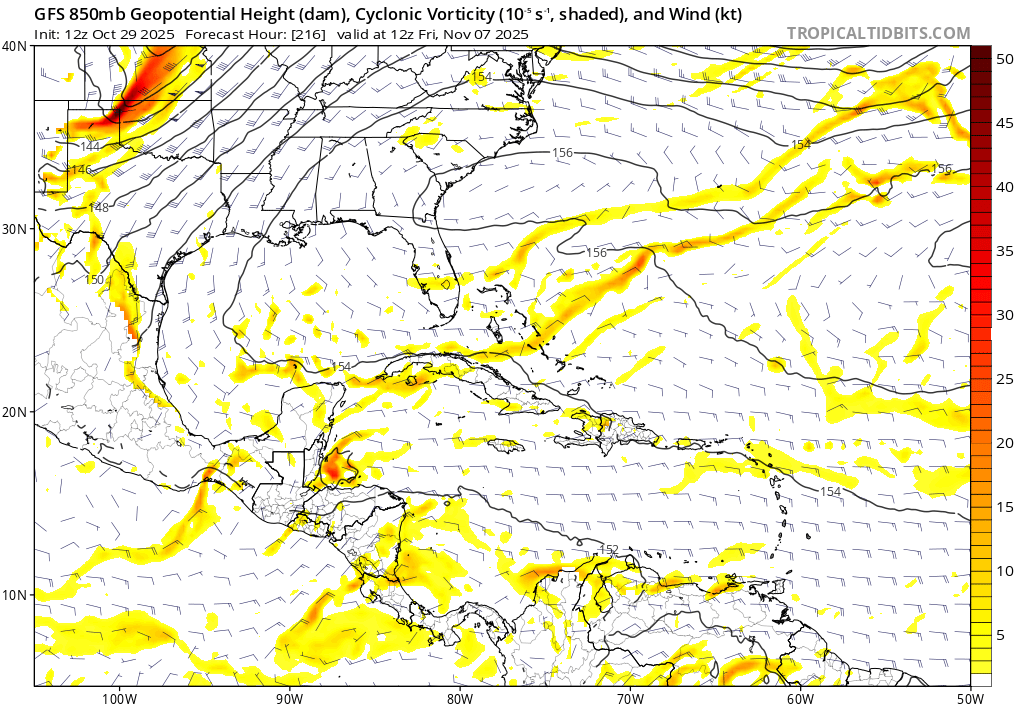
Further out ...

leads to
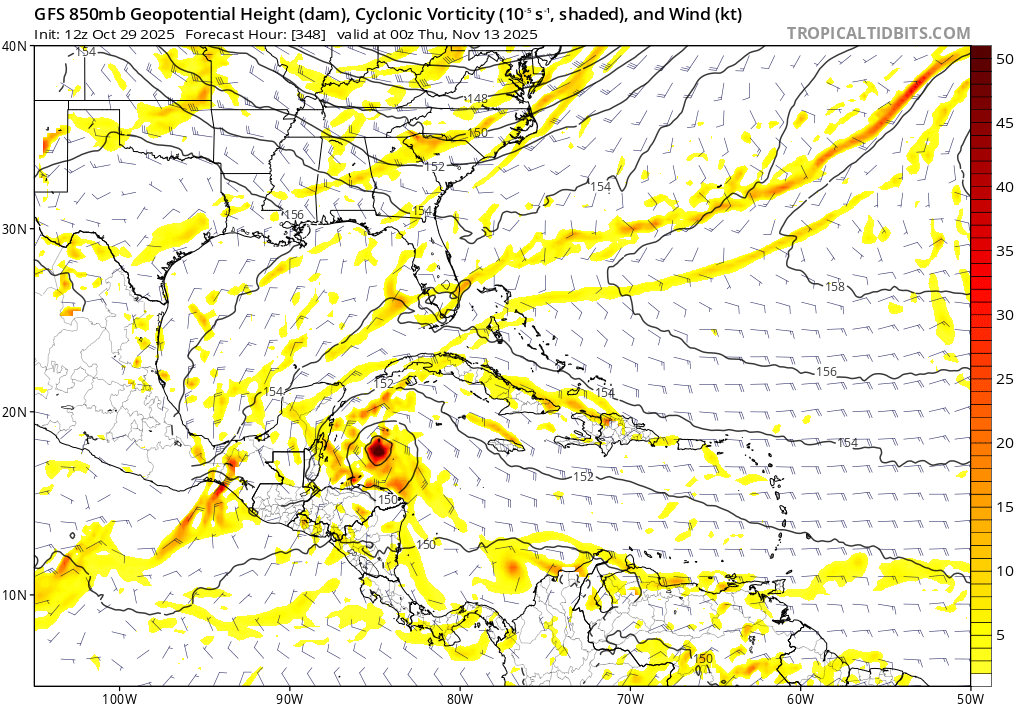
Google from 28/00Z to 29/12Z had no Caribbbean genesis tracks (after going through my tracker); it did so previously as I mentioned. I did try to double check genesis events with the weatherlab site for older Google runs and didnt observe anything (as <24 hour storms will be filtered by my tracker) -- although weatherlab site is currently throwing an error message saying its bugged but didn't provide details..
~
I consider Melissa now relying on mainly Google 12Z (as I speculate that the regional modells will be worse )..
Colostate through 12Z is 127.1, while the 12Z best track point is 0.81 ACE for the below analysis (from which I deduct as appropriate).
12Z OFCL/OFCI/HCCA seem to provide in the range of 9-10 ACE - 0.81~= 8.2-9.2 ACE - this looks too optimistic considering Google... (NHC did reference HAFS and the consensus aids for its last forecast as far as intensity).
After doing some of the below analysis, 18Z OFCI came in at 7 ACE with all of its points. This is also a higher end figure possibly given that it includes some clearly post/extratropical points), so excluding past 31/18Z the 18Z OFCI drops down to 5 an additional ACE (after colostate 12Z estimate, and interpolating its points).
Google/12Z forecasts strengthening through tomorrow morning... however it looked weaker than expected in both OFCL and Google as mentioned in the 15Z discussion.
Subsetting on the 12Z tracks by vmax in various ways still indicates strengthening through 30/12Z but with slightly a less higher end mean and an earlier dissipation time in the smallest subset (10% of members) that I checked (members with points of <=80kt at 18Z point).
After subsetting, the expected amount of ACE decreased slightly from 6.3 ACE with all members to 5.5 ACE in the smallest subset. However this requires removing the 12Z point so we should deduct another 0.83 ACE leading to either an additional expected ACE of either 4.7 ACE (smallest subset) or 5.5 ACE (full set).
The last 21Z NHC official lowered their forecast a bit, andthey note it is relatively on the low end to the regional models), but considering the google 12Z that was subsetted seems justified.
Notably the 18Z NHC official ACE (excluding points past 31/18Z) is 6.3 ACE (a bit higher than even my expectation from Google).
All together you would expect 5-6 ACE, however I am a bit more bullish as NHC expects post-tropical transition between 31/18Z and 01/00Z, but based on my lower end predictions from Google and subjectively NHC being a bit to slow to update on when it becomes extratropical, I am expecting a bit earlier around 31/06Z to 21/12Z. (I did previously several days ago anticipate it would become post-tropical by 31/18Z so this is a small update today). This also explains in part why they get more ACE through 31/18Z (as Google tracks all end earlier), so I discount that it will survive so long.
Google 12Z mean (not subsetted) showing strengthening for a 12 hour period from 30/00Z tonight to 30/12Z (it actually looks like gradual intensification since it is only 10 kt, but since the best track is 80 kt at 18Z. ... 20kt/12 hours would be RI, and some of the subsetted google tracks indicate this). I would like to discount this given that none of the AI-RI or SHIPS indicators indicate this (12%) (though we will have to wait for 00Z for it to line up better).
So given the above the most likely scenario is still an additional 5 ACE.... This would seem to put as at around 132.1 ACE (still well above the bin margin). (edited)
YYMMDDHHmm, (lat, lon), vmax10m, mslp
2510291200 ( +20.70, -75.80) 89.0 968.0
2510300000 ( +23.35, -74.54) 88.7 968.3
2510300300 ( +24.09, -74.09) 93.4 964.3
2510300600 ( +24.82, -73.64) 98.0 960.4
2510300900 ( +25.71, -73.00) 99.3 958.8
2510301200 ( +26.59, -72.36) 100.6 957.3
Based on the above scenarios with a TS being only 30% I guess for the rest of November and likely contributing meagerly towards ACE (1 ACE) in November, I've largely exited most of my positions considering the market is at 96%, and that its still easily more than 10% chance we will have to wait for the post-season TCR
Another minor correction to the above, based on when Melissa becomes post-tropical..
My tracker for the latest 06Z google run fails given the 6h point -5 deg boxing filter I apply, this caused me to examine the track data and historical data and noticed my tracker has an issue due to its fast forward speed (9% of storms are faster in that latitude) ...
~
This may have effected the last couple calculations I did for ACE (minus 1 extra synoptic point) as based on the SSTs several days ago and older global model runs I predicted around 31/18Z (mainly focusing in on the latitude), but then updated to 31/06-12Z based on the recent google tracks yesterday showing it appear to become extratropical around where I expected, however there is a chance because of its fast forward speed it may last a bit longer due to my tracker dropping the points for the very fast distance it crosses from 31/06Z to 31/12Z (this is still earlier than NHC I think by about 6-12 hours -- cant tell with the 12h points); so its possible it doesn't becomes post-tropical for the 15Z advisory at the latest as I updated the other day, and instead the 21Z advisory instead.
For the Google 06Z run, the point for the 30/12Z mean is 70 kt, 31/18Z point is 65kt, so my numbers in the last update could have been low in the calculation by up to ~ 0.5 to 0.9 ACE.
I did not redo them but then 132.6 ACE or 133.0 ACE would be the adjustment based on this (based on an early 15Z extratropical advisory or a 21Z extratropical advisory).
~ Below notes are the calculations for summary above:
(marked is the distance it travels from 31/06Z to 01/06Z for one of the tracks -- its very likely to be post tropical by then despite the track being shown starting again)
Relevant NHC points from 15Z advisory:
 24H  31/1200Z 37.5N  62.5W   80 KT  90 MPH
 36H  01/0000Z 43.8N  55.8W   70 KT  80 MPH...POST-TROP/EXTRATROP
Before discussing further the relevant context from the NHC 30/15Z advisory...
The satellite presentation remains fairly impressive, with
an eye feature emerging on GOES 19 imagery over the past couple of
hours. Some slight additional strengthening is possible for another
few hours while Melissa remains over marginally warm sea-surface
temperatures, but the water temperatures will rapidly decrease
tonight while wind shear rapidly increases. As a result, Melissa is
expected to quickly lose tropical characteristics once it passes
Bermuda, and it is forecast to become a strong post-tropical cyclone
over the North Atlantic by Friday night. The latest NHC intensity
forecast remains towards the higher end of the guidance envelope,
and more closely follows the global models during the extratropical
phase.
Melissa is accelerating toward the north-northeast, now moving 30
degrees at 21 kt. A faster motion is expected during the next
couple of days as Melissa moves within the flow between a
mid-level trough over the eastern U.S. and a subtropical ridge
over the central Atlantic. The guidance is in excellent agreement
through the next 48 hours, until after the system makes its closest
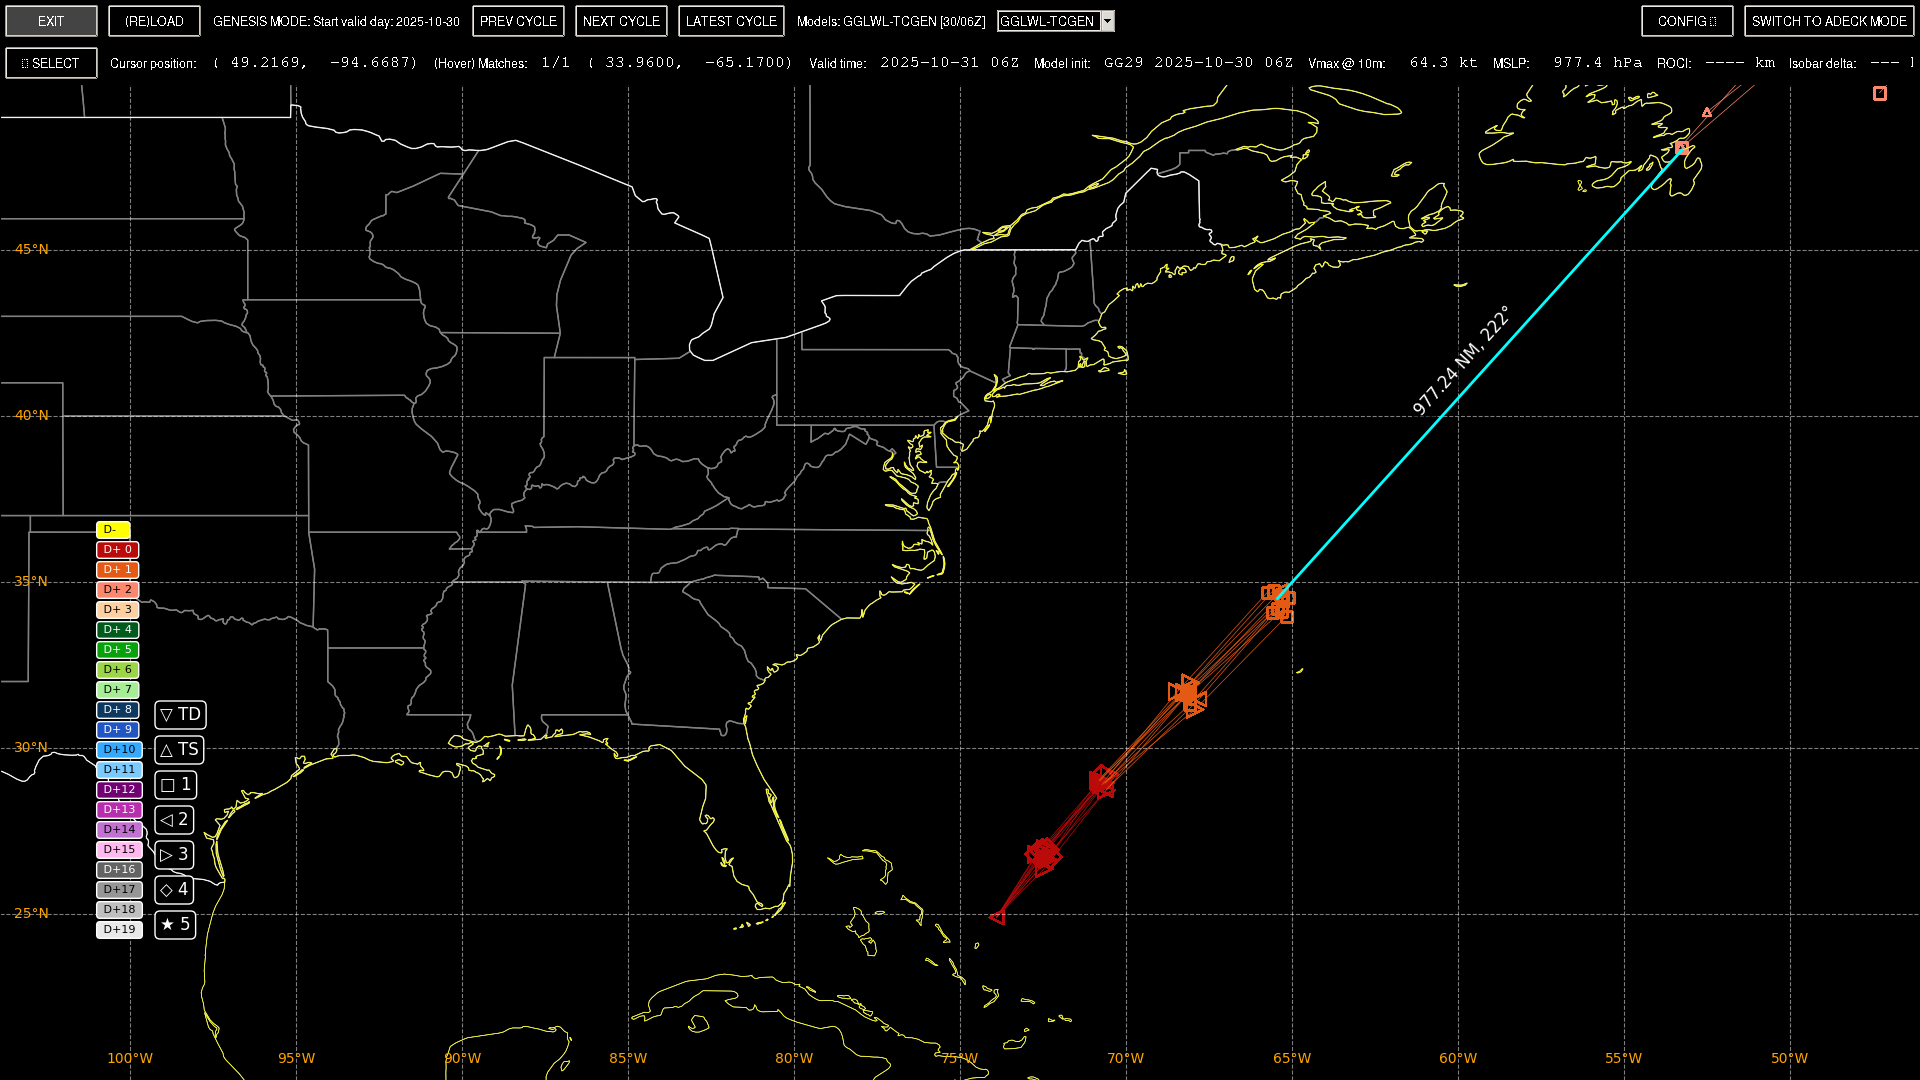
approach to Atlantic Canada.Comparing Melissa's Google's 30/06Z run's members, has most of its 31/06Z-12Z points travelling a median distance of ~454km during this time...
Google 30/06Z run
describe() for 'dist_6h_km' filtered by 2025-10-31 12:00:00
count 50.000000
mean 458.879312
std 25.888986
min 402.428324
25% 443.609382
50% 454.143680
75% 478.918980
max 524.092981
Name: dist_6h_km, dtype: float64
Referencing my climatology notebook (based on ibtracks, including only ts, ss, hu synoptic points), the 6h dist crossed historically in the ATL by storm (taking the max distance per storm for each bin), and considering the points for Mellissa roughly in the 35-40 lat bin:
NA LAT bin 35°–40°
Total storms in bin: 199
Storms with dist_6h_km_max > 454 km: 18
Percentile of 454 km: 91.0%
One interpretation is that it is just an usually fast storm (top 9% historically), but another is that with such a fast forward speed is more likely to be extratropical by this 12Z point, as usually such forward speed is typically seen when it is nearly already post/extratropical...
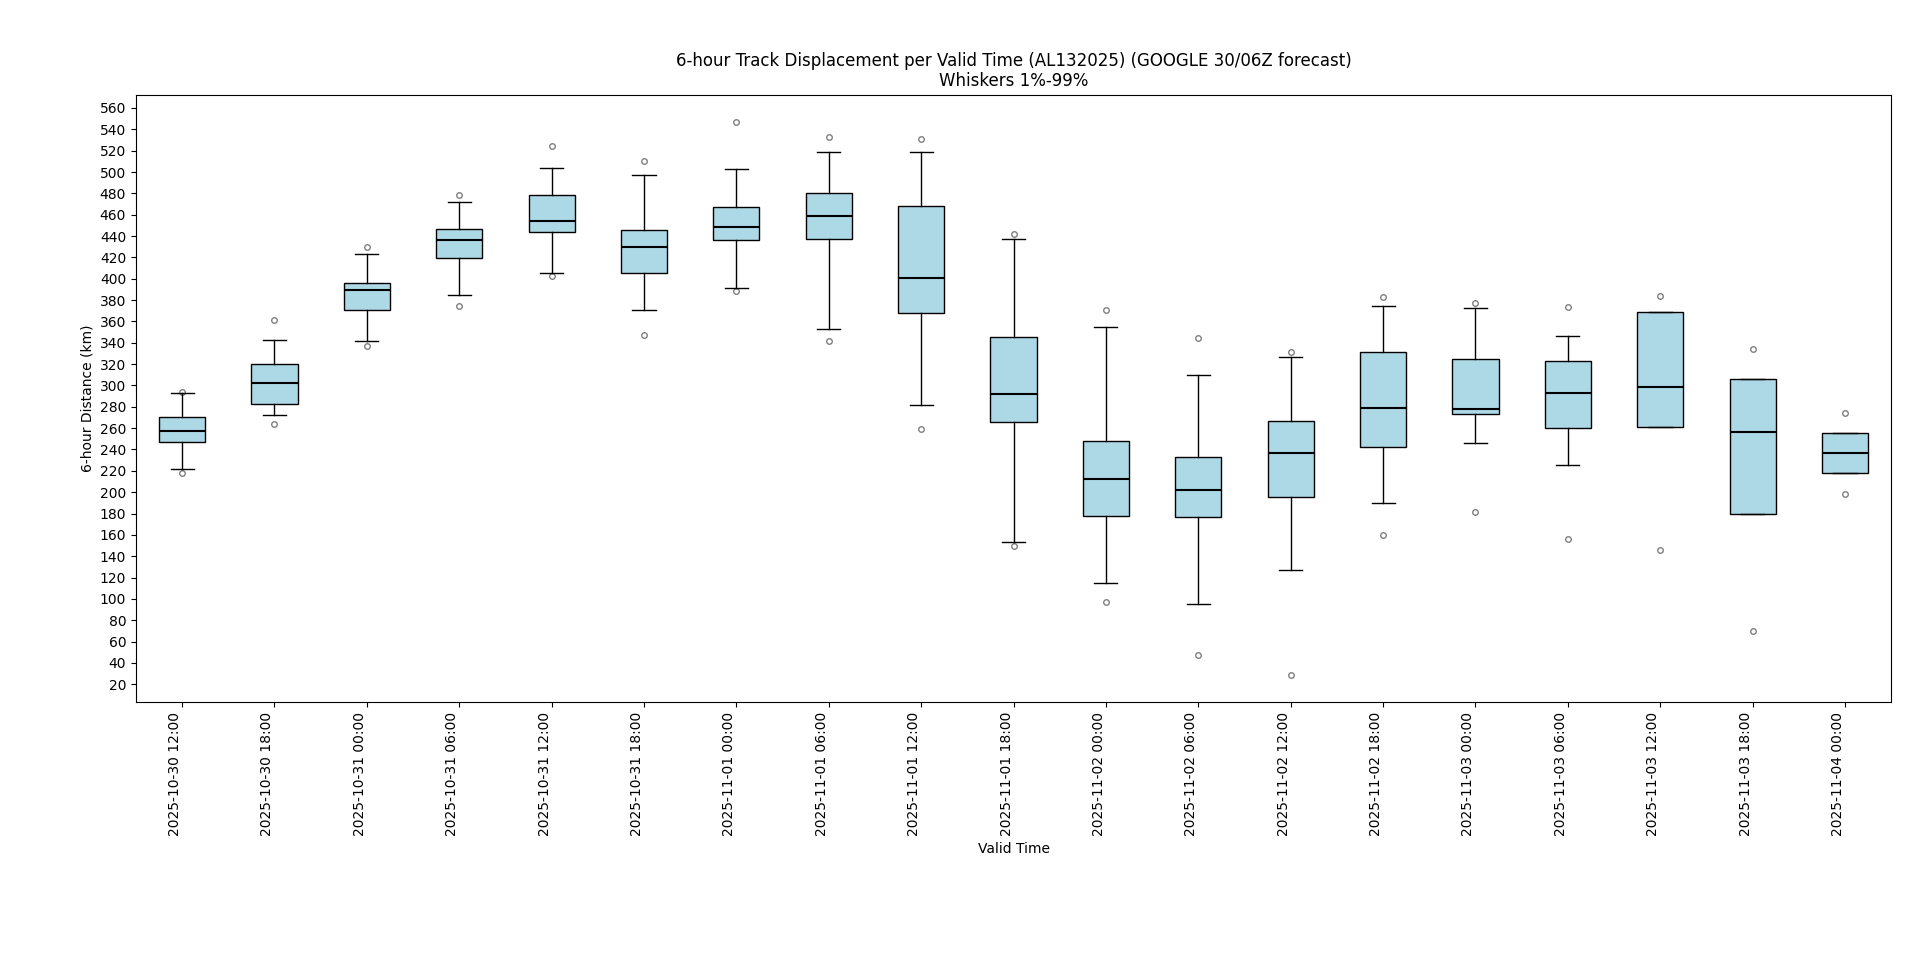
Note whiskers are for the 1-99% quantiles
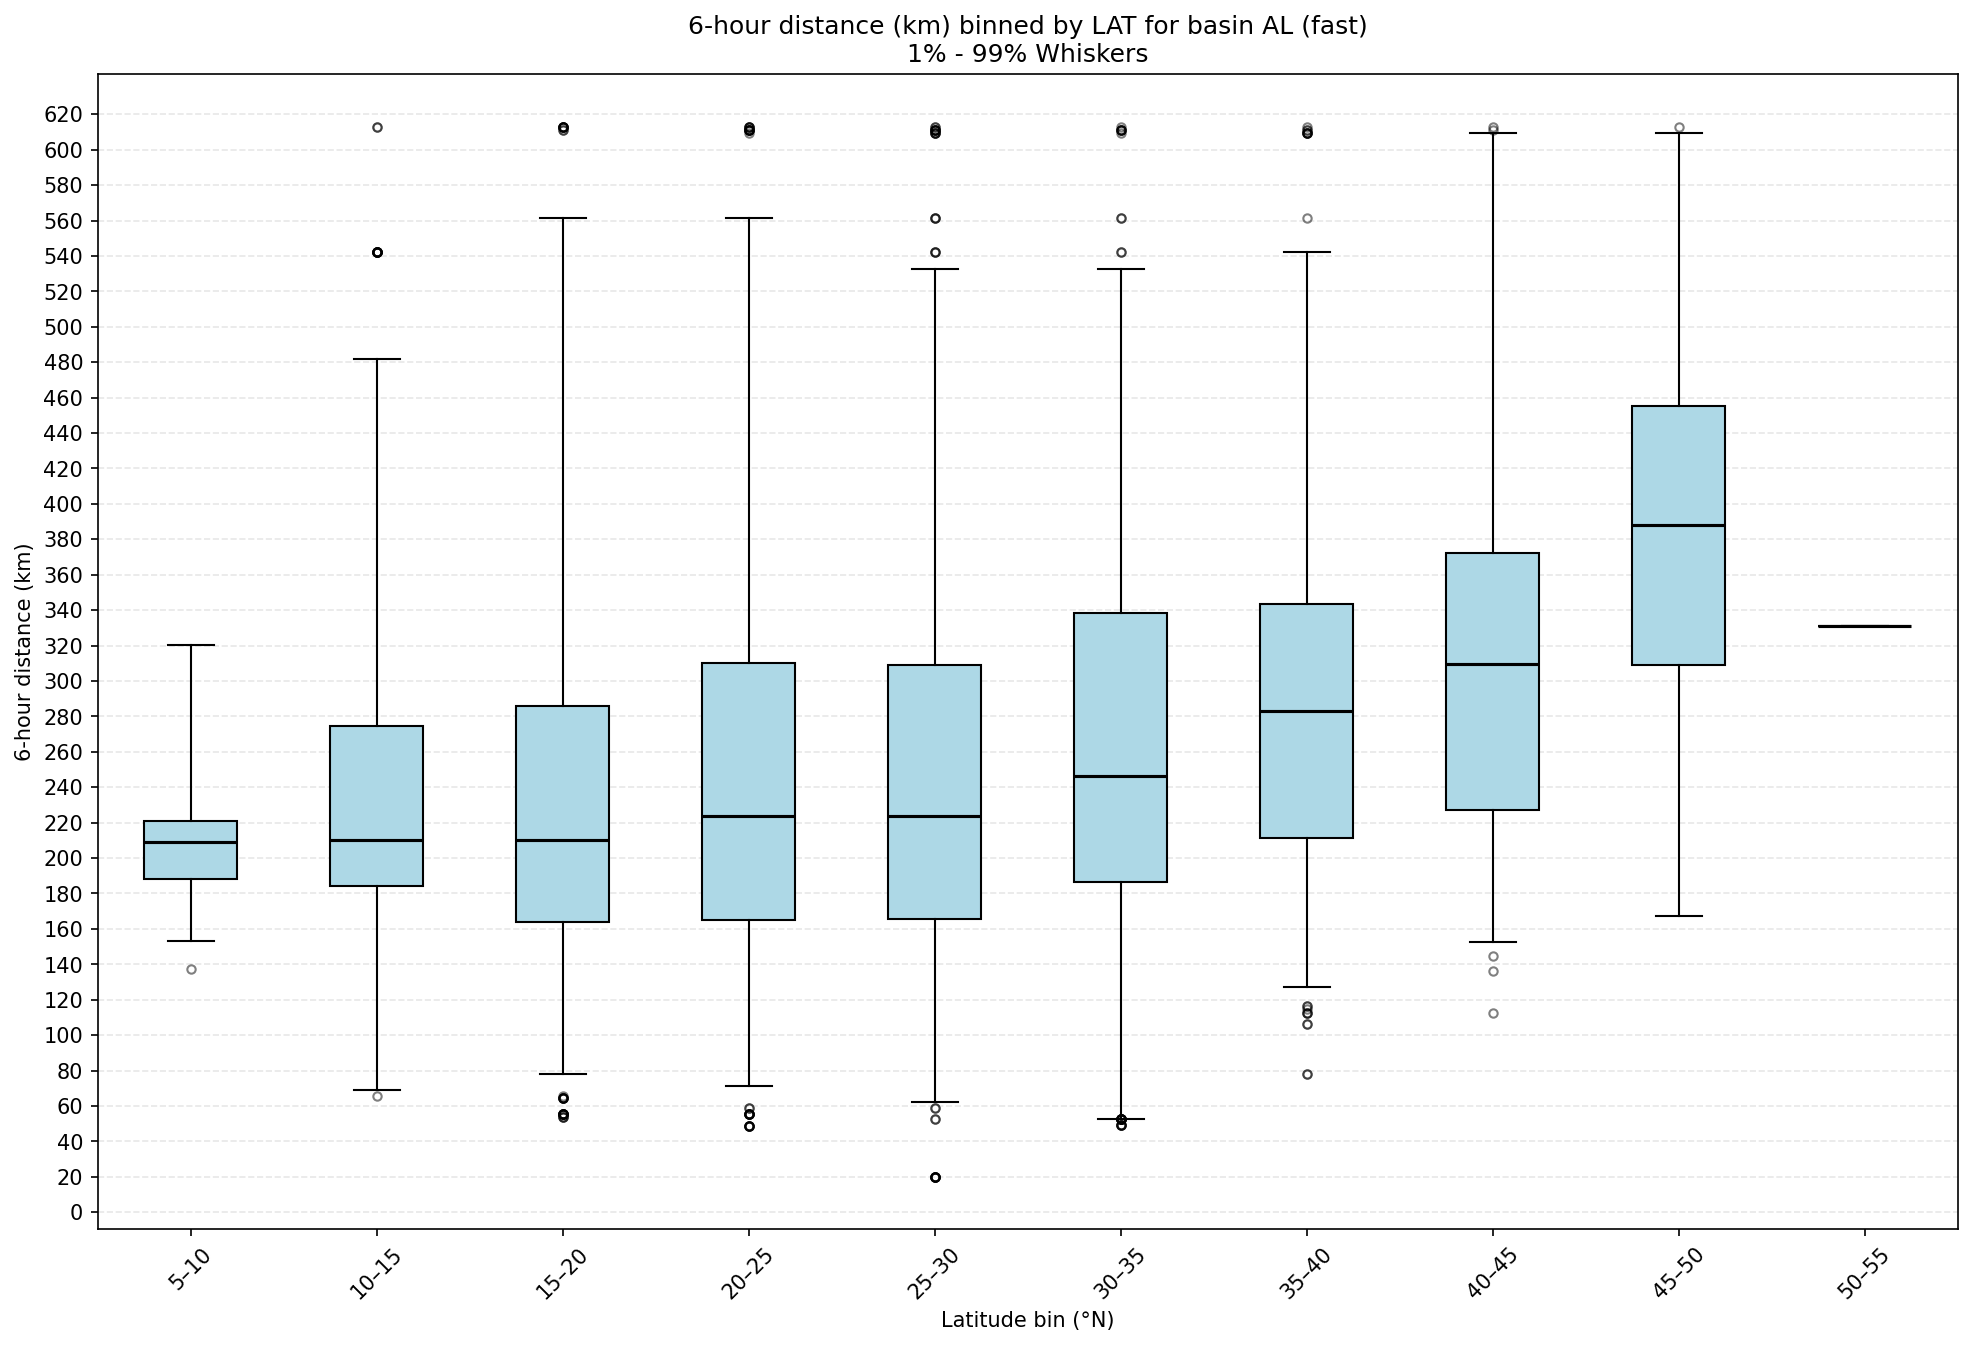
NA LAT bin 35°–40°
Total storms in bin: 199
Storms with dist_6h_km_max > 454 km: 18
Percentile of 454 km: 91.0%
Cases > 454km:
SEASON NAME ISO_TIME LAT LON USA_WIND dist_6h_km_max
901 1998 LISA 1998-10-09 06:00:00 36.8 -37.9 60.0 613.019052
6704 1999 IRENE 1999-10-18 12:00:00 36.8 -71.6 90.0 610.973382
1171 2000 HELENE 2000-09-23 18:00:00 35.4 -78.0 35.0 609.239989
7498 2005 WILMA 2005-10-25 12:00:00 36.8 -67.9 90.0 561.456976
8050 2011 MARIA 2011-09-16 00:00:00 36.8 -64.8 70.0 542.106074
6863 2000 MICHAEL 2000-10-19 06:00:00 36.3 -65.5 65.0 532.621354
7144 2004 ALEX 2004-08-03 18:00:00 35.3 -75.2 85.0 523.312653
8285 2014 GONZALO 2014-10-18 12:00:00 35.6 -62.6 85.0 515.937288
8966 2020 EPSILON 2020-10-24 00:00:00 36.1 -62.0 75.0 503.854906
5905 1994 FLORENCE 1994-11-07 18:00:00 35.4 -53.1 90.0 498.778991
9189 2022 FIONA 2022-09-23 18:00:00 37.8 -61.7 110.0 489.042119
9062 2021 LARRY 2021-09-10 06:00:00 36.5 -62.2 75.0 481.866304
224 1993 FLOYD 1993-09-09 00:00:00 35.3 -67.8 40.0 478.703053
8240 2014 CRISTOBAL 2014-08-28 12:00:00 36.3 -67.1 70.0 478.104519
8335 2015 KATE 2015-11-11 06:00:00 35.2 -67.6 70.0 474.653448
394 1995 FELIX 1995-08-20 06:00:00 35.0 -67.9 60.0 465.961442
1488 2002 GUSTAV 2002-09-10 18:00:00 35.0 -75.4 55.0 455.498153
5056 2020 ZETA 2020-10-29 12:00:00 35.3 -83.6 45.0 454.422537
When comparing 00Z GFS and ECM runs earlier today I did note ECM had quite a bit higher VWS (in a selected box) then GFS, smaller MUCAPE, and less 300-700mb humidity overall in the southern Caribbean in the window in week 2 below, where genesis chances are very slim overall, but appear to pick up in GEFS. This week looks like a dud for the reasons I mentioned last week (dry-air coming into the Caribbean from the Atlantic). Haven't looked at other products like NCICS or EMCWF's products so I haven't finished a detailed update for my own expectations for week 2-3 ....
Relevant part of latest CPC outlook, that came out today:
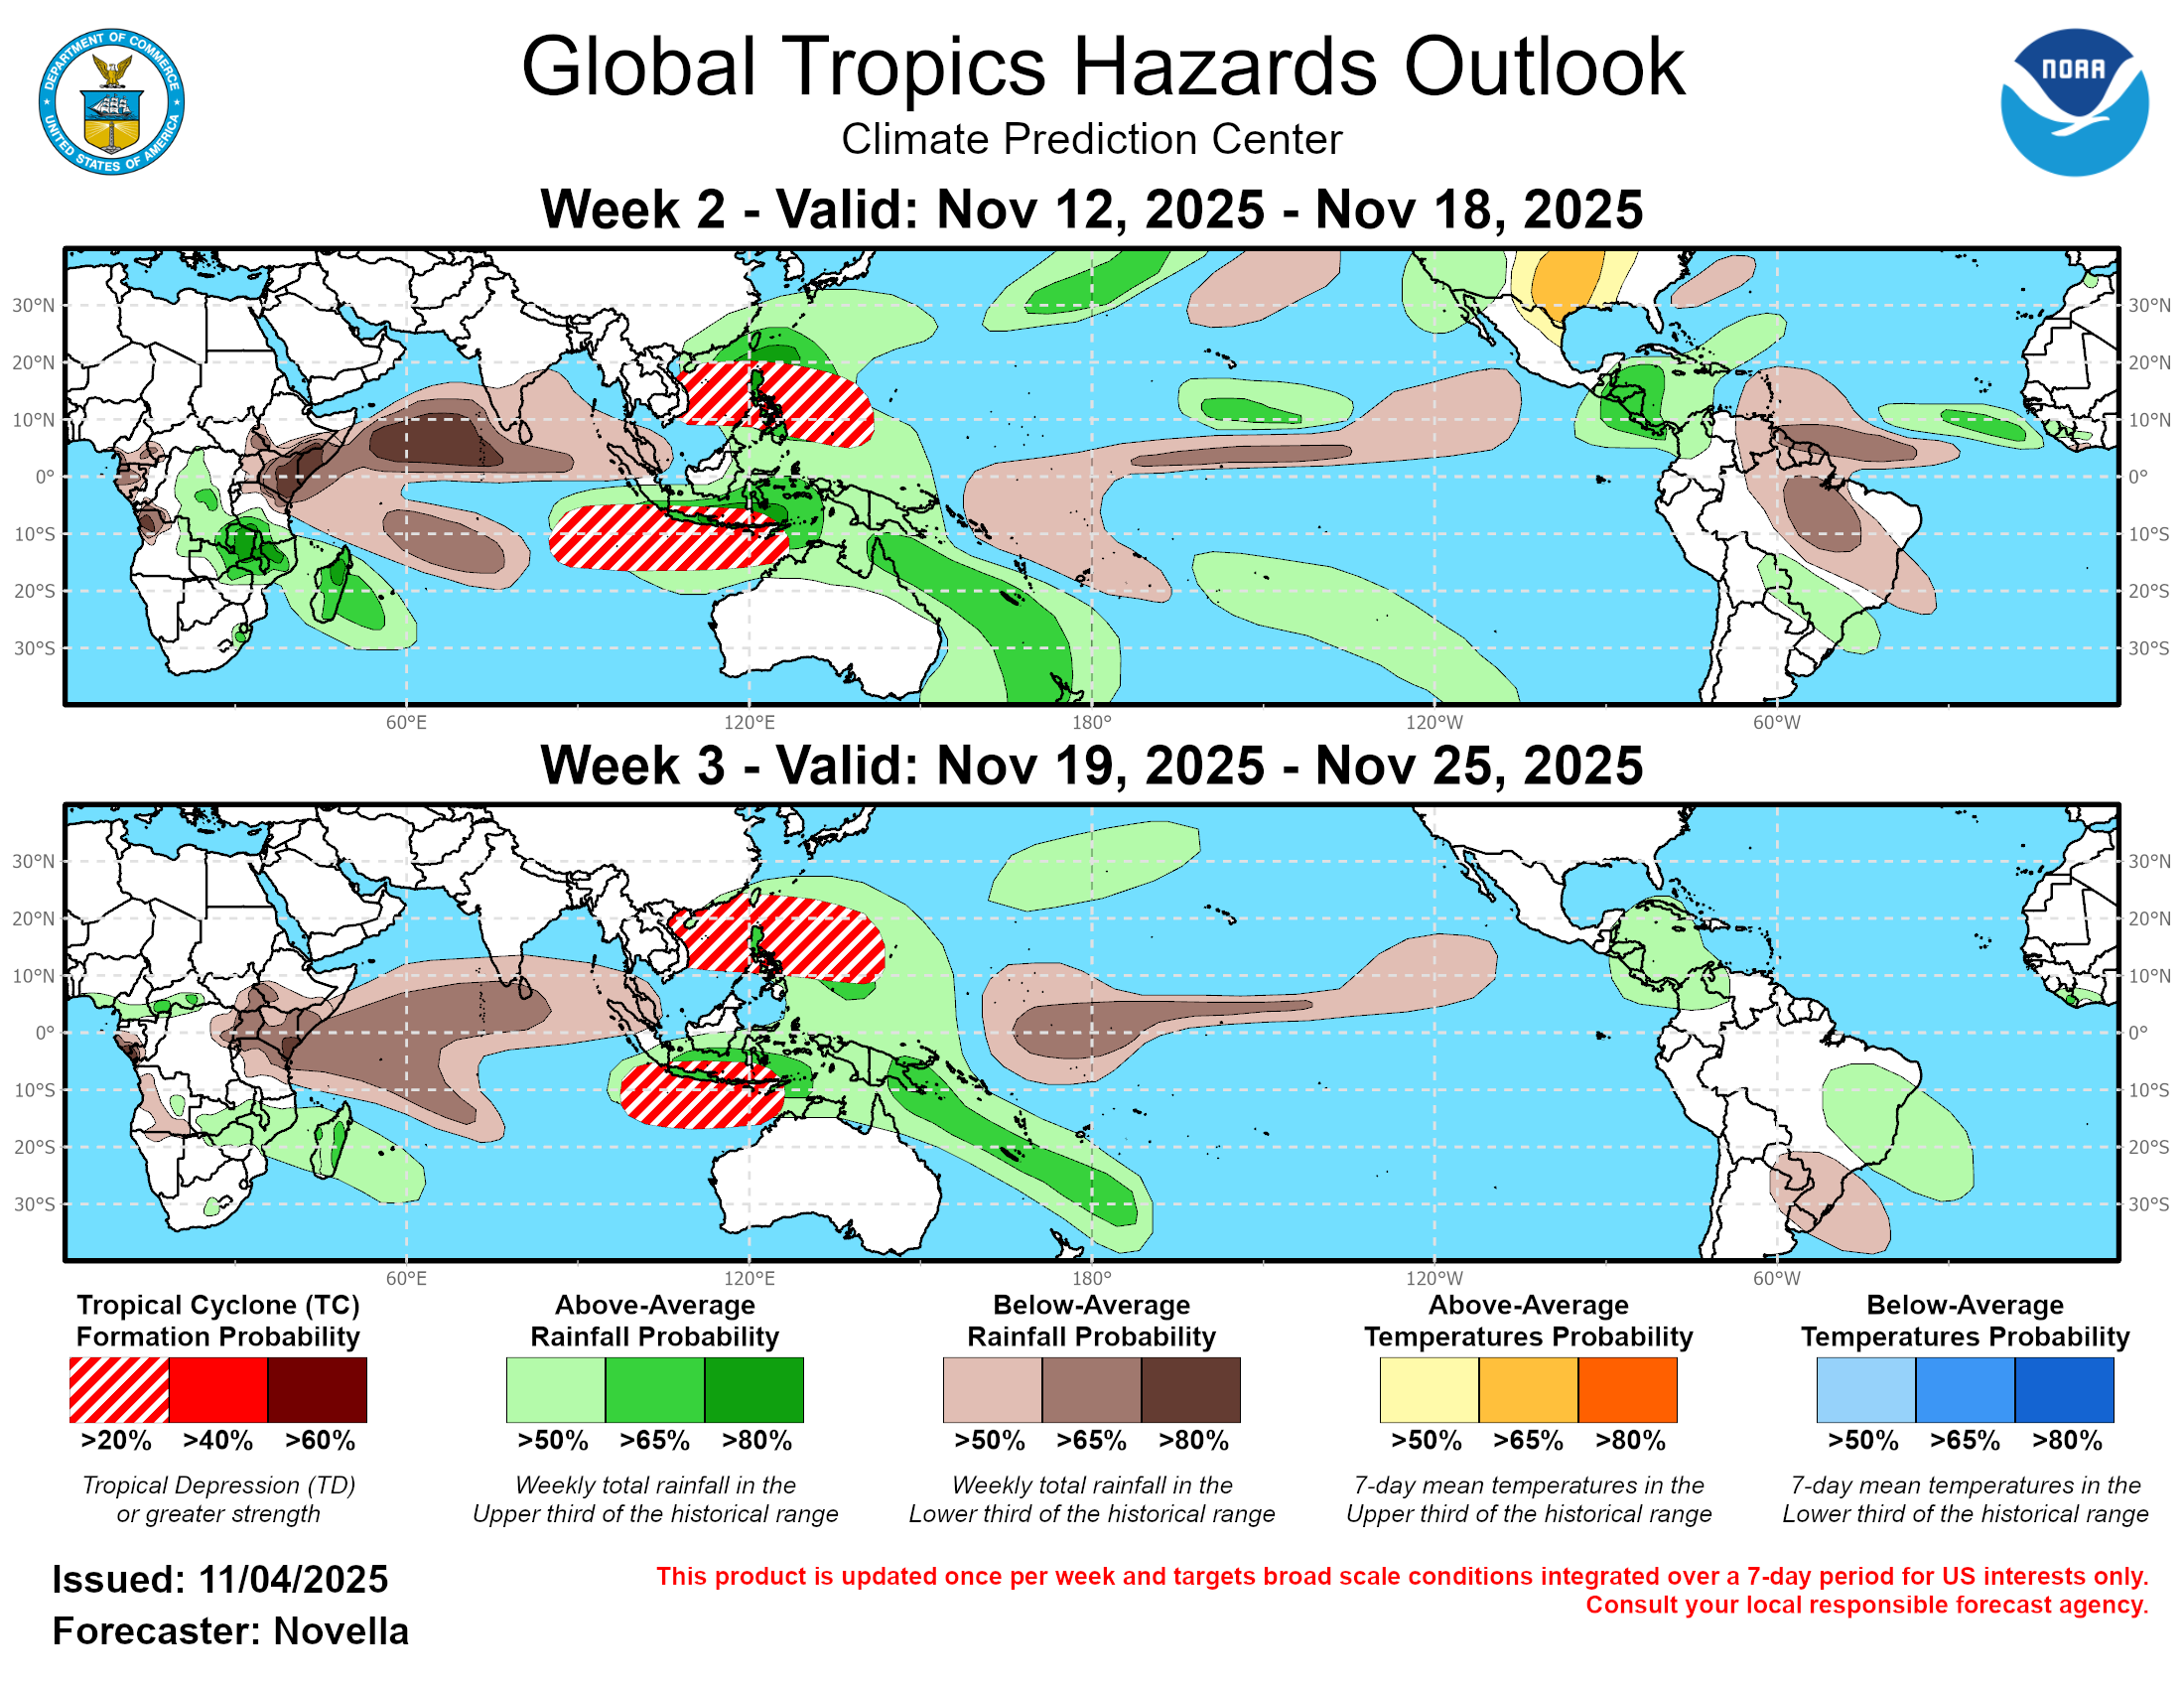
"
In the western Hemisphere, probabilistic genesis tools continue to depict modest signals in the southern Caribbean, with the GEFS being strongest with TC potential towards mid-November. While TC development cannot be ruled out, no corresponding TC areas are posted for week-2 due to high false alarm rates in the GEFS, lesser support in the Google AI guidance, and near to above-normal shear conditions favored. By week-3, shearing is favored to ease in the GEFS and ECMWF guidance, however a much quieter climatology over the Caribbean during the 3rd dekad of November precludes the issuance of any TC areas for week-3. In spite of having no TC areas being posted, near to above-normal precipitation remains favored over Central America and the western Caribbean, where any enhanced precipitation amounts may exacerbate ground conditions and stall recovery efforts in Jamaica following the devastating impacts of Hurricane Melissa last month.
"
Very roughly (not considering the actual latitude/longitude for individual tracks) based on the mean track for Google 12Z I am guessing it will become post-tropical/extratropical after Oct 31 18Z, so the following ACE chart is based on points from 25/12Z to then. Based on this forecast you could expect 25-35 ACE within this time frame. (I've usually ended up erring on the high side, but at least 25 seems reasonable to me if it becomes a Cat. 5, which is in the latest 21Z NHC forecast now).
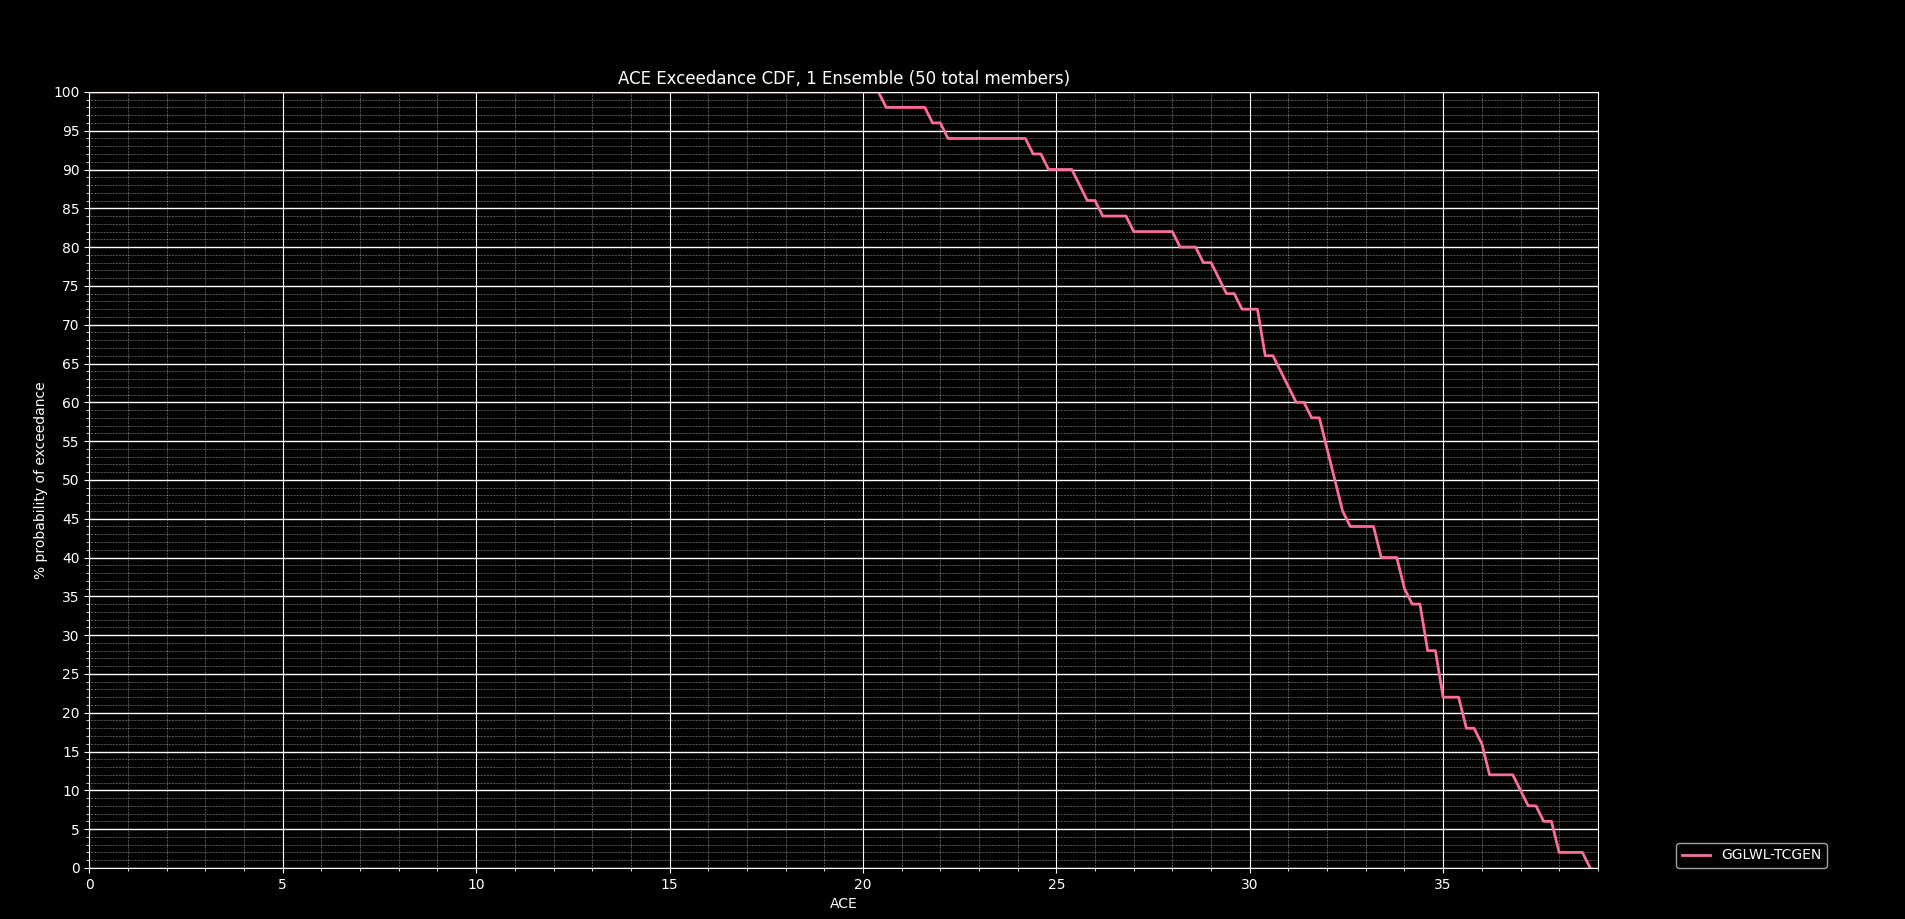
It seems likely we will come close if not exceeding the 126.1 threshold after Melissa dissipates, but I do note I have been repeatedly too optimistic with regards to these model based ACE predictions this past year so 20-30 might be more reasonable; so I have been anticipating we will be close to the bin edge. Regardless, this storm alone will likely put us in the scenario for the resolution criteria of again having to wait until the TCRs are done next year, unless we get a November hurricane of perhaps 10 ACE or more to push us over. So far, based on following some of the systems this year I am subjectively expecting a minor downgrade in the ACE after this year's TCRs (but I haven't done any calculations), so if it is very close I am leaning towards it being below normal in this scenario (if someone wants to predict this you only need to look through the discussions and find keywords of "generous" or "conservative" for that advisory as that is the usual language for when they indicate the intensity may be off, and the correlate that with the vmax for ACE adjustments).
As for a further storm developing early November, looking at NCICS tropical monitoring site I do see some indication of a low briefly developing with some very minor spin in a couple weeks, but looks unlikely to develop into a TS. Not predicted in the last CPC long-term outlook either. Conditions don't look good for any sufficient development related to this market
ECMWF does show a TD potentially forming there though, so I suppose I can't rule it out completely from this simple analysis, but its chances of a TS are in the 5-10% range. Further out to the 24th chances seem marginal.
Edit:
Referencing my climatology notebook, we should statistically we expect the chances of another hurricane in the last week of November to be about 5%, and from Nov.4 to 31 about 27% - but given that this looks a lot less likely from the subseasonal forecasts I looked at I discount this essentially.
Edit:
The climatology ACE chart from colostate shows historically about 5 ACE from the period of Nov. 4-31. So, a Caribbean storm with high enough ACE seems an unlikely scenario now and still seems like we will end up having to wait to next year, in which I am still anticipating a downgrade.
so if it is very close I am leaning towards it being below normal in this scenario
Do you mean ‘near normal’?
@MachiNi I did not write that correctly... I meant the ACE after revision will likely will be below the bin edge i was talking about (126.1) ... (and end up falling in the normal season ace bin)
La Niña now per NWS, but can we expect much more development to bring us above normal?
The latest enso forecast (IRI Columbia) dynamic avg puts at -0.71 C for OND….
2000, 2016, 2021 look to the the closest most relevant years.. but only 2016’s Hurricane Otto (which was an outlier all by itself) generated any significant ACE in November (About 8 ACE late November before crossing into the EP)
~
Looking at OFCL and HCCA about 9-12 more ACE seems to be expected but this may be optimistic it seems to me… (currently at 93.2 ACE, so this should put us over 100 ACE if Jerry survives the shearing it will continue to undergo…. I did anticipate incorrectly we would be a bit over 100ACE a couple weeks ago with Humberto and Imelda, but both became extratropical well before originally forecast). In any case we should be around 100 ACE or a bit more within a week.
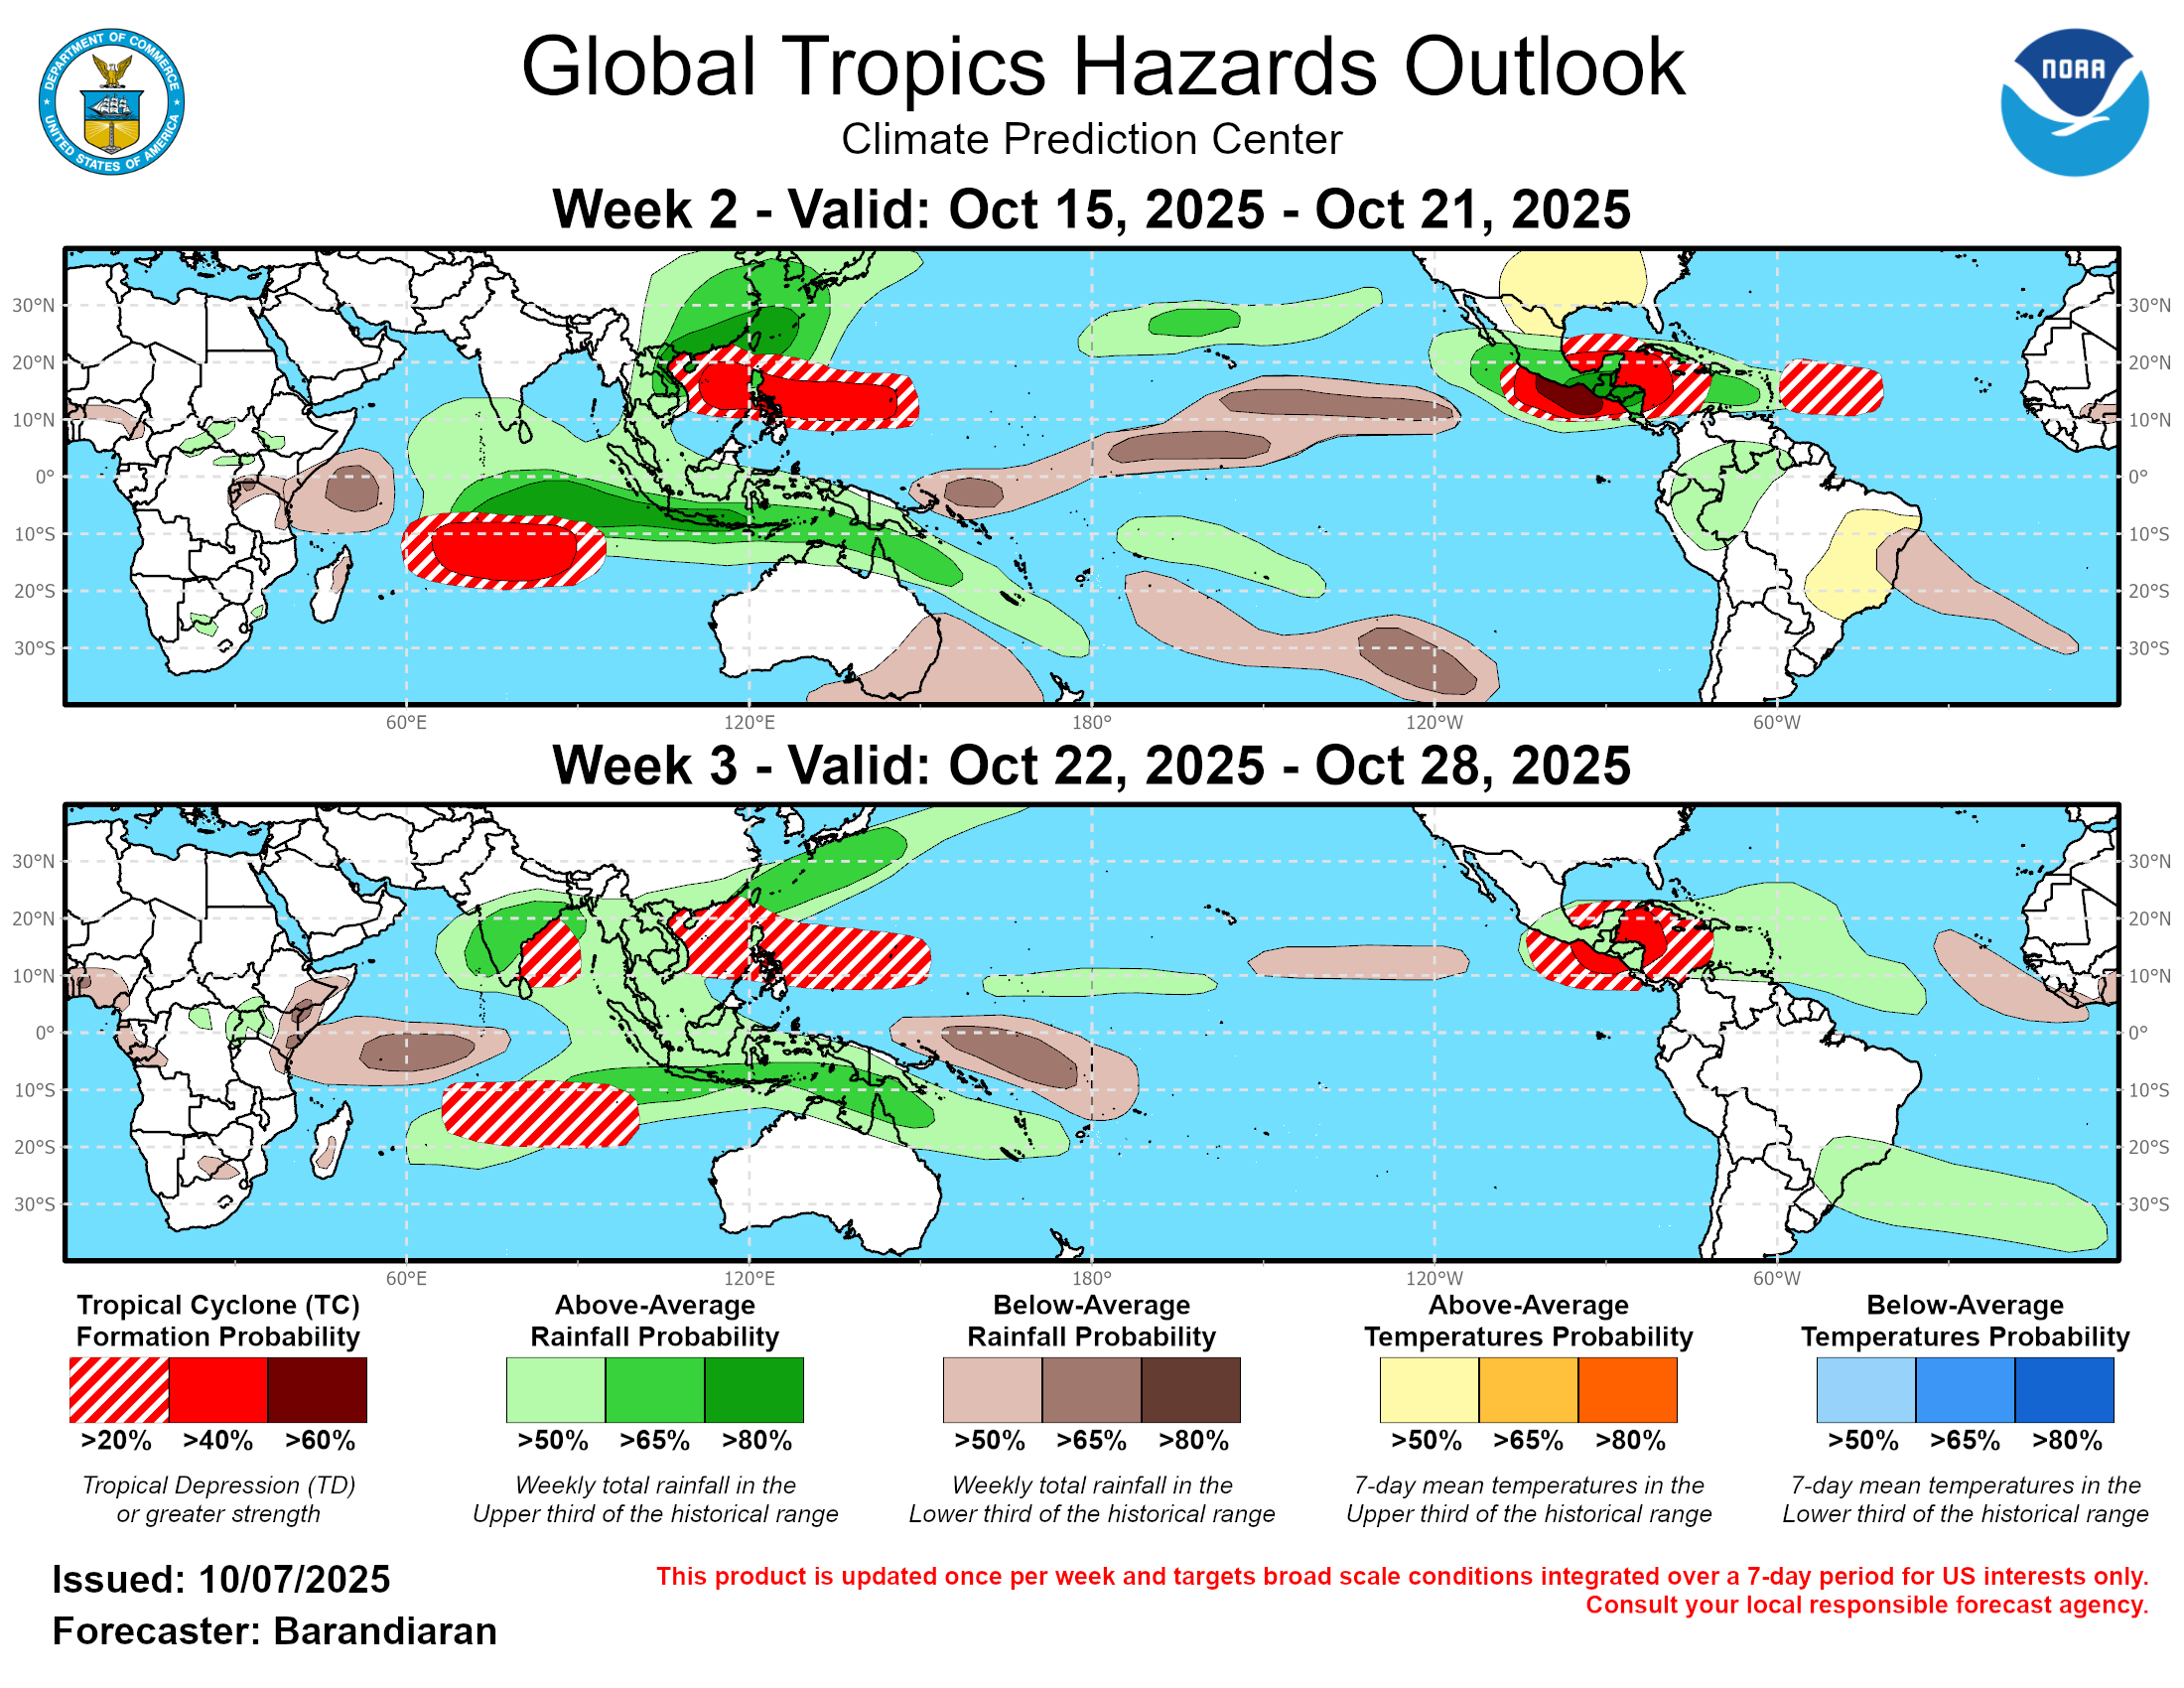
Last CPC outlook from a couple days ago shows some development chances around a CAG developing and some chances for a system developing from the MDR it approaches the Caribbean
Looking at google 06Z today (00Z shows something similar but less tracks in it heading into the Caribbean), I can see quite a bit more support than I last looked for such a MDR system beyond the next 7 days (17-21st of Oct) (I do recall it did also have a signal for Jerry’s development way beyond the usual 7 day window); not much support in next couple weeks for anything in Central America..
Per GFS/00Z looking at tropical tidbits, a wave is forecast to come off Africa over the next day however that particular wave only has little support (10% or less about).
However. Another wave is forecast to come off in 3-4 days that will have very slow development as a subtropical ridge develops north of it, leaving it fairly dry for a while as the AEJ will be moderate.. the ridge looks like it will be influenced by the remnants of Jerry as it passes by north of it — so there is one other obvious reason to not have high confidence in this solution… the model shows winds should pick up after a few days and increase its chances to develop though.
Based on google 06Z an optimistic chance of development this far out would put it at 40-50% for a TS and perhaps 20-30% for a hurricane, but it’s still very far out … Far out enough to not know even if it develops whether it will be steered into the Caribbean, curve NW as it approaches the Leeward Islands, or recurve fairly early. Barring an ideal scenario for developing ACE ( a long running track through the Caribbean like Beryl or another Humberto — highest ACE was 26 among the members ) it seems a bit unlikely but not impossible at the moment for such a single system to bring us the 26 ACE or so to bring us above normal (4 is the median for the incomplete tracks, with 8 the mean, so 10-20 would seem optimistic through the 21st of Oct.). That leaves about 5 weeks afterwards to generate anywhere from 5-20 ACE the necessary amount.
The 1991-2020 climo for Oct 22 to Nov 30 suggests about 12 more ACE for that time. So with an expected ACE of about 4 from the mean of a future Karen through Oct 21. And at least another 12 ACE that might plausibly come from the GoM or Caribbean from a different storm or two, that puts us at about at least 100+4+12= 116 ACE. If Jerry develops as expected that would bring us to less than 10 ACE from above normal. We would need a fairly active end of October or November to bring us to above normal, but we should expect a slightly more active end to the season given we are in a La Niña now, all other things being equal, as we should expect shear to be less of a limiting factor. Given the ample amount of OHC left in the likely areas for genesis it’s still possible for an above normal season (albeit it seems less likely at this moment).
NHC has downgraded Jerry's forecast twice in last couple advisories, and updated when they think it will become post-tropical.
At 94.4 ACE as of 06Z per colostate..
A quick manual calculation from the latest advisory, where I put it as post-tropical at 14/00Z yields another 3.31 ACE:
>>> x = [45, 45, 45, 45, 50, 50, 50, 50, 50, 50, 50, 50, 50, 50]
>>> np.sum(np.pow(x, 2)) / 1e4
np.float64(3.31)
The new Subtropical Storm Karen is forecast to become post-tropical tonight, should add another ~ 0.3 ACE on top of that based on the latest advisory.
This ields about 3.6 ACE, or 98 ACE after these two systems finish.
Google 00Z (40% a TS, 28% hurricane), and 06Z (38% a TS, 26% a hurricane) has dropped the chances of a previously mentioned MDR system down a bit, however the mean ACE though is now 12.9 for 06Z (so an expected 4.6 ACE still seems plausible based on that 36% chance).
98+4+12 = 114 ACE would seem to be expected, a bit less plausible then yesterday when we were 10 ACE away, now we are 12 ACE away from 126 ...
Should note, for 06Z there are some seemingly implausibly strong members (this would break a record I think) near the end of the forecast period for those members that make it into the Caribbean (the OHC is very high there though)..
ensemble_agg_max:
storm_ace (10^-4): 33.0
storm_vmax10m (kts): 177.9
sst_mean (C): 30.2
sst_min (C): 29.7
sst_max (C): 31.0
ohc_mean (kJ * cm^-2): 122.3
ohc_min (kJ * cm^-2): 84.1
ohc_max (kJ * cm^-2): 174.3
We are at 96.2 ACE now that Jerry and Karen are finished, and needing another 30ACE seems like a large ask, yet we have 1-2 systems left with chances for October in the models.
If AL97 becomes Lorenzo, it will add a tiny bit of ACE (1-2 ACE?), but the other system previously mentioned has been having a probability that has been shrinking in Google runs but still has decent chances in the EPS/00Z run (50%). I noted the Google 06Z run had another ~40 ACE outlier, with a median/mean of 12 when conditionalizing on the tracks that do form). Even if it provides half of that, an additional GoM / Caribbean hurricane in late October/November could put us over as mentioned previously.
Downbetting again a below normal season:
Currently at 49.8 ACE, and Gabrielle should bring 5-15 more ACE (hard to tell when it will become post-tropical/extra-tropical) with some very rough estimates (mixing NHC/HCCA/Google).
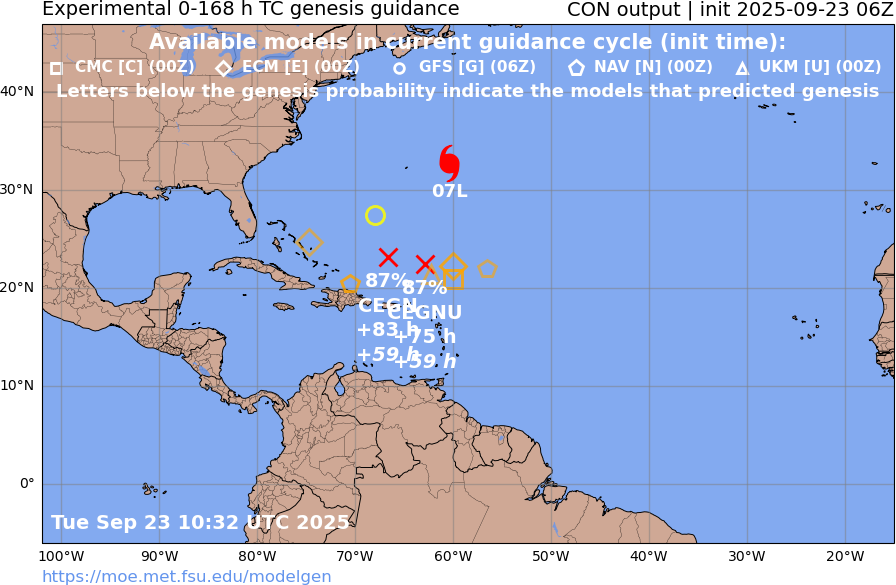
93L and 94L each both have roughly at least a 90% chance of becoming a TS each (based on FSU's chances of a TC (which will likely become a TS with the high SSTs), and the Google 23/06Z run (which essentially all of its members show a TS in the next 7-8 days).
I get ~14 ACE and 9 ACE respectively from the mean from google's tracks.
So, estimating the expected ACE from these 3 systems (taking the most conservative Gabrielle ACE value of 5):
5 + 0.9*13.7 + 0.9*8.7 = 25.16 ACE is the amount of expected ACE I would expect from these 3 systems.
This should takes us above a below normal season.
@SaviorofPlant Good report. Most surprising was the low vertical wind shear anomaly:
"Current 30-day-averaged zonal vertical wind shear is the 2nd lowest on record across the western Atlantic (10–20°N, 85– 50°W) (Figure 22)."
CPC has also issued their forecast today.
https://www.cpc.ncep.noaa.gov/products/precip/CWlink/ghaz/index.php