Data is currently at
https://data.giss.nasa.gov/gistemp/tabledata_v4/GLB.Ts+dSST.csv
or
https://data.giss.nasa.gov/gistemp/tabledata_v4/GLB.Ts+dSST.txt
(or such updated location for this Gistemp v4 LOTI data)
January 2024 might show as 124 in hundredths of a degree C, this is +1.24C above the 1951-1980 base period. If it shows as 1.22 then it is in degrees i.e. 1.22C. Same logic/interpretation as this will be applied.
If the version or base period changes then I will consult with traders over what is best way for any such change to have least effect on betting positions or consider N/A if it is unclear what the sensible least effect resolution should be.
Numbers expected to be displayed to hundredth of a degree. The extra digit used here is to ensure understanding that +1.20C resolves to an exceed 1.195C option.
Resolves per first update seen by me or posted as long, as there is no reason to think data shown is significantly in error. If there is reason to think there may be an error then resolution will be delayed at least 24 hours. Minor later update should not cause a need to re-resolve.
 1,000
1,000People are also trading
Reading rec : https://mailchi.mp/caa/another-el-nino-already-what-can-we-learn-from-it
Good discussion in latest Hansen newsletter of El Niño, brief discussion of RONI (https://www.bom.gov.au/climate/enso/?ninoIndex=nino3.4&index=rnino34&period=weekly#overview-section=Monitoring-graphs is a good source for it)
Hansen provides some hedging material (based on climate priors) given the NCEP spread
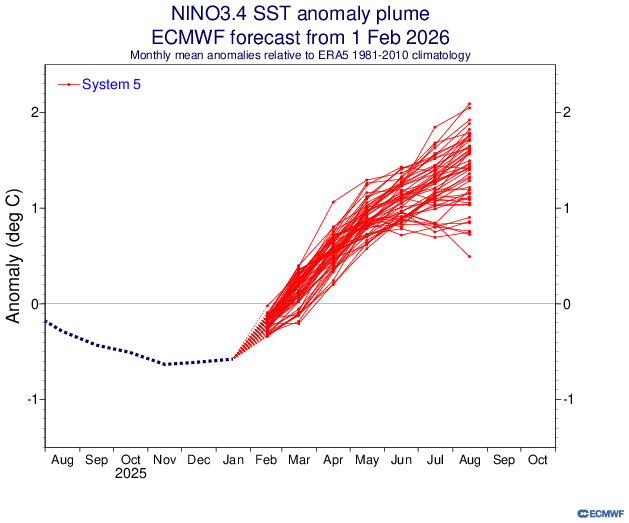
But despite the lower end spread in the NCEP runs for even a no El Niño scenario, the ECMWF plumes show greater likelihood in the Feb run than the Jan run, with a higher end and mean going into June and July (a good percentage of members showing a strong El Niño, indicating a moderate strong or strong El Niño is likely )
Re La Niña minimum.. it seems guaranteed we will not drop this year below the 1.4 C (12 month mean)….
More exceptional will be it looks like two back to back strong El Niño will happen based on the ECMWF El Niño plumes..
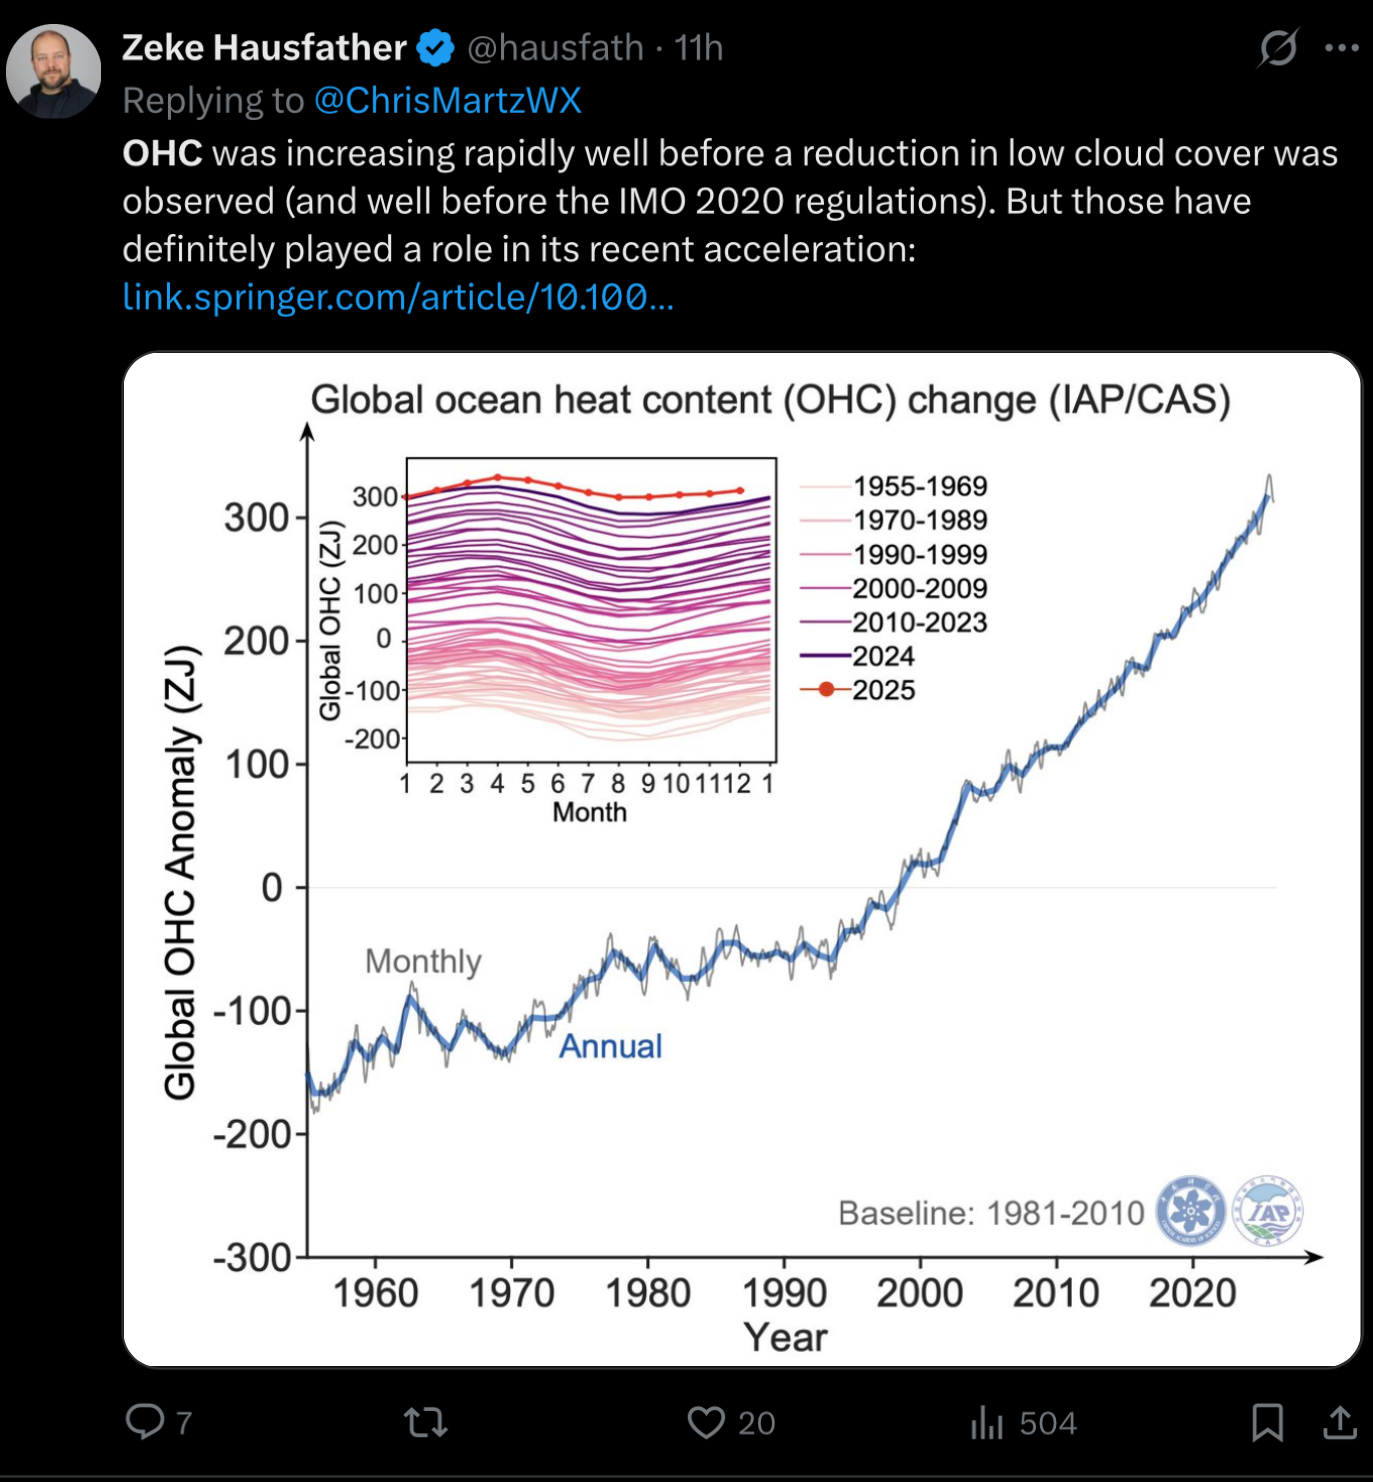
The OHC and anomalies are quite absurd…
Despite the how badly Hansen burns Zeke for his error bars, Zeke has put a lot of emphasis on it lately in his posts and in turn we see Hansen focusing on it this newsletter…
Edit Feb 5: first revision of ghcnm did come late (see lower comment)... so what I said at the bottom no longer looks likely...
While the ERSSTv5 data became available yesterday we still have no GHCNm data for 2026... (technically we have been seeing ghcnm revision updates but no 2026 data)
Not 100% clear to me if this is from the new notice (regarding ngdc) as it doesn't seem to have anything to do with the ASOS and GCHN data... (I note that the search interface for the GCHNh data reveals even a lot of the US data is far behind.)
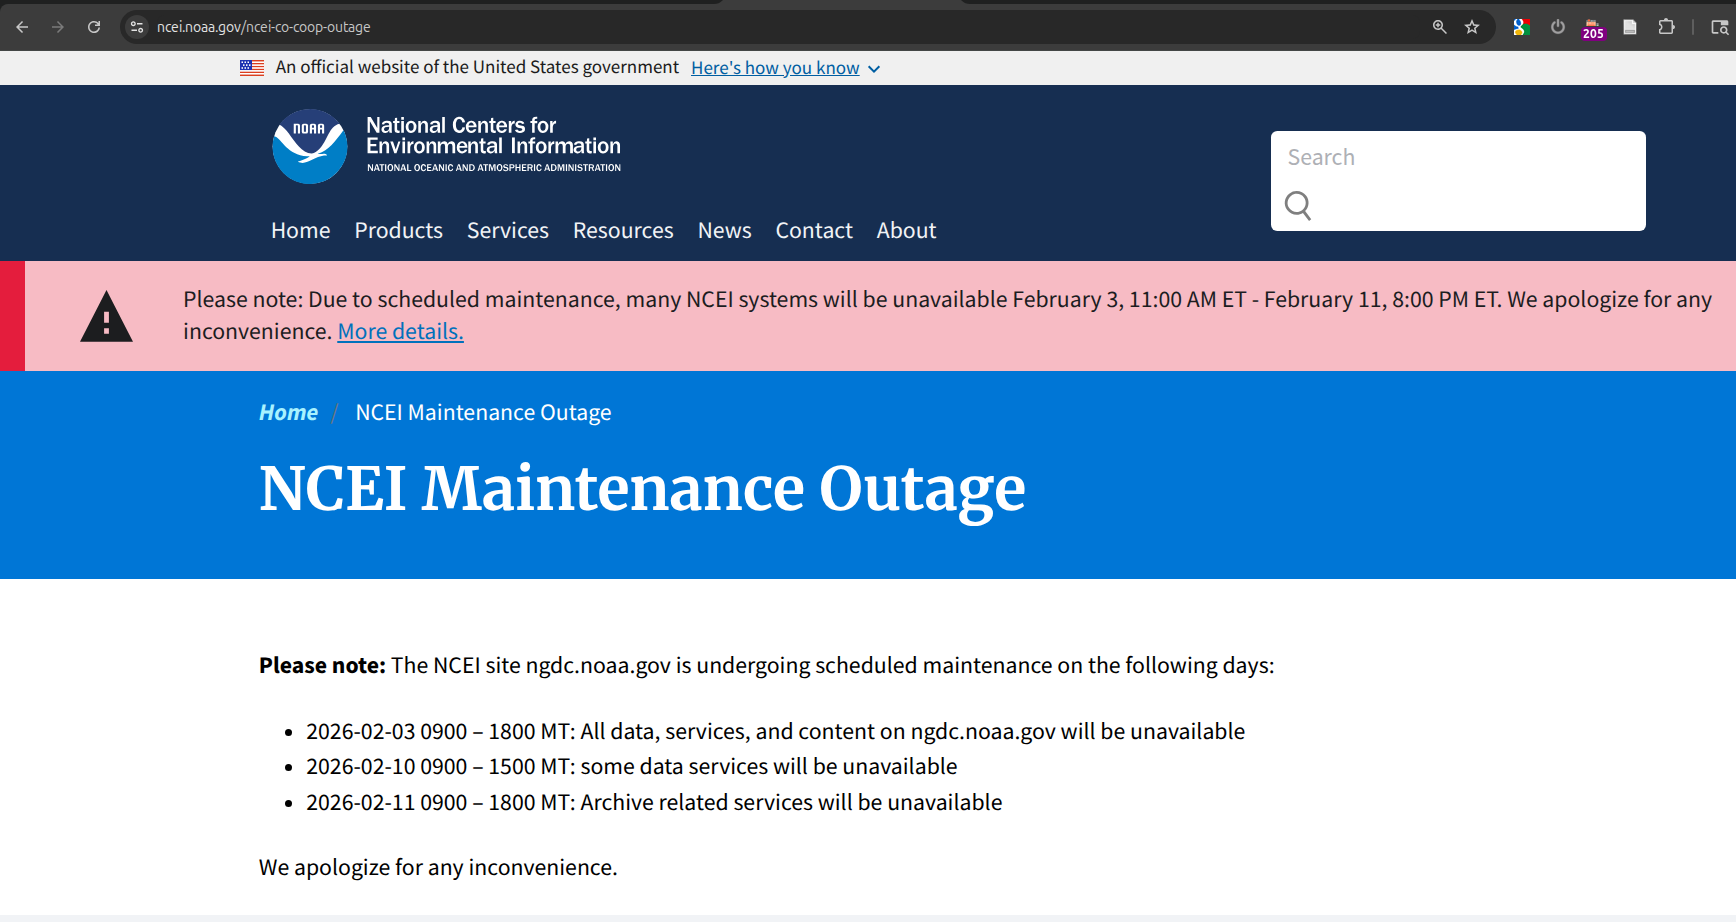
It seems more likely whatever delay there is with the GCHN data its still part of the ongoing upgrade process. Given this is abnormal and looking at the available GCHNh at this point we should probably expect a delay in the release this month ...
Oof something happened in the latest ghcm (ghcnm.v4.0.1.20260205). Probably should discard it for doing any runs (technically looks like better coverage but its missing more stations then yesterday)....
Yesterday:
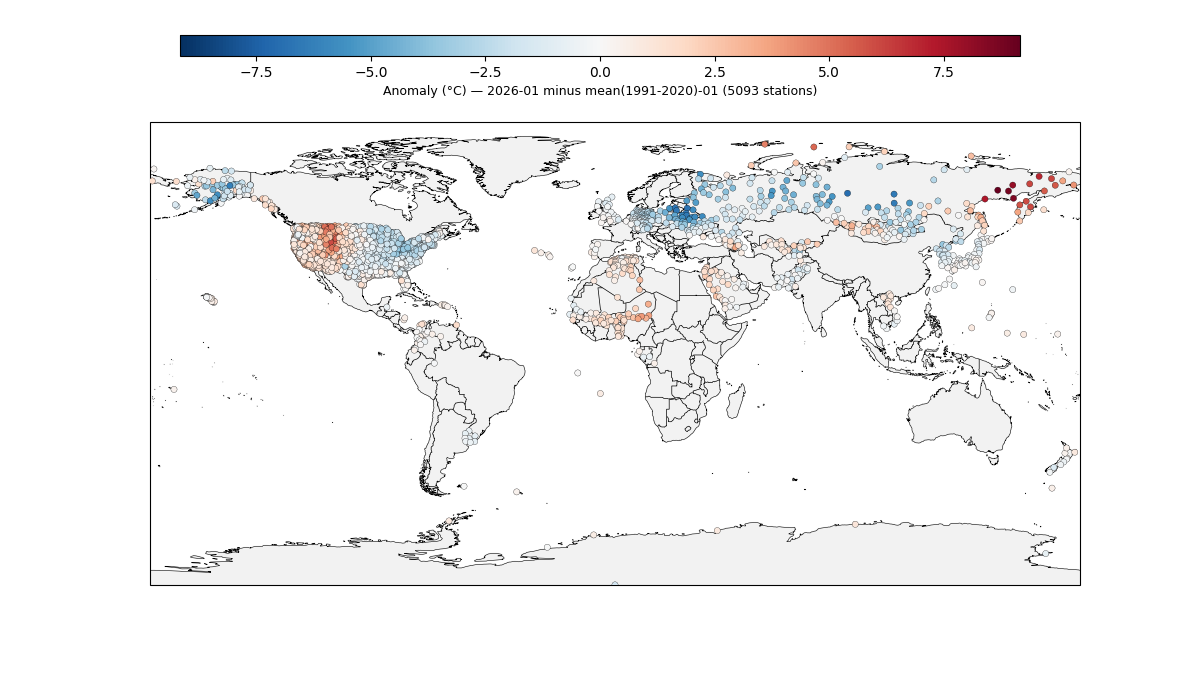
Reference range 1991-2020, month 1: 17866 usable stations, Overlap 5093
Today:
Reference range 1991-2020, month 1: 15758 usable stations, Overlap 3932
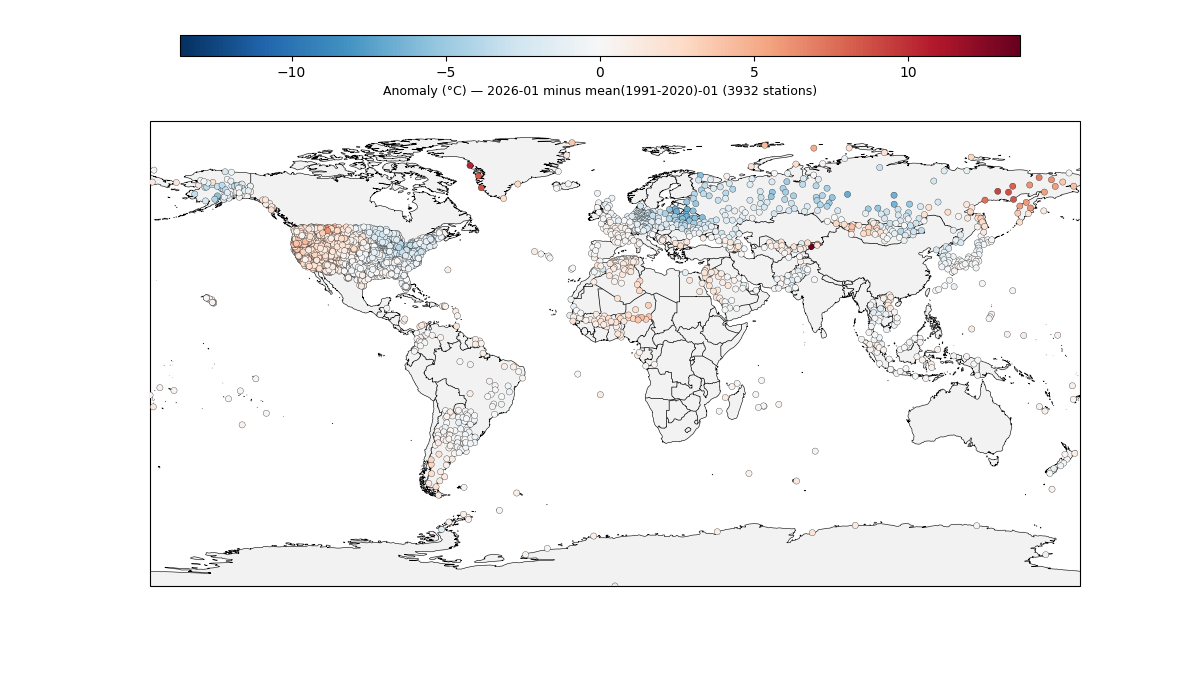
@Rhhgdd Looks good.. On the high side for my end as a center point prediction (~1.135), but I haven't looked at the spatial anomalies to see how if there are any particular areas where data availability might bias it.... (Also the Jan month model is one of those that have a fairly large ERA5->gistemp correction in my linear model)...
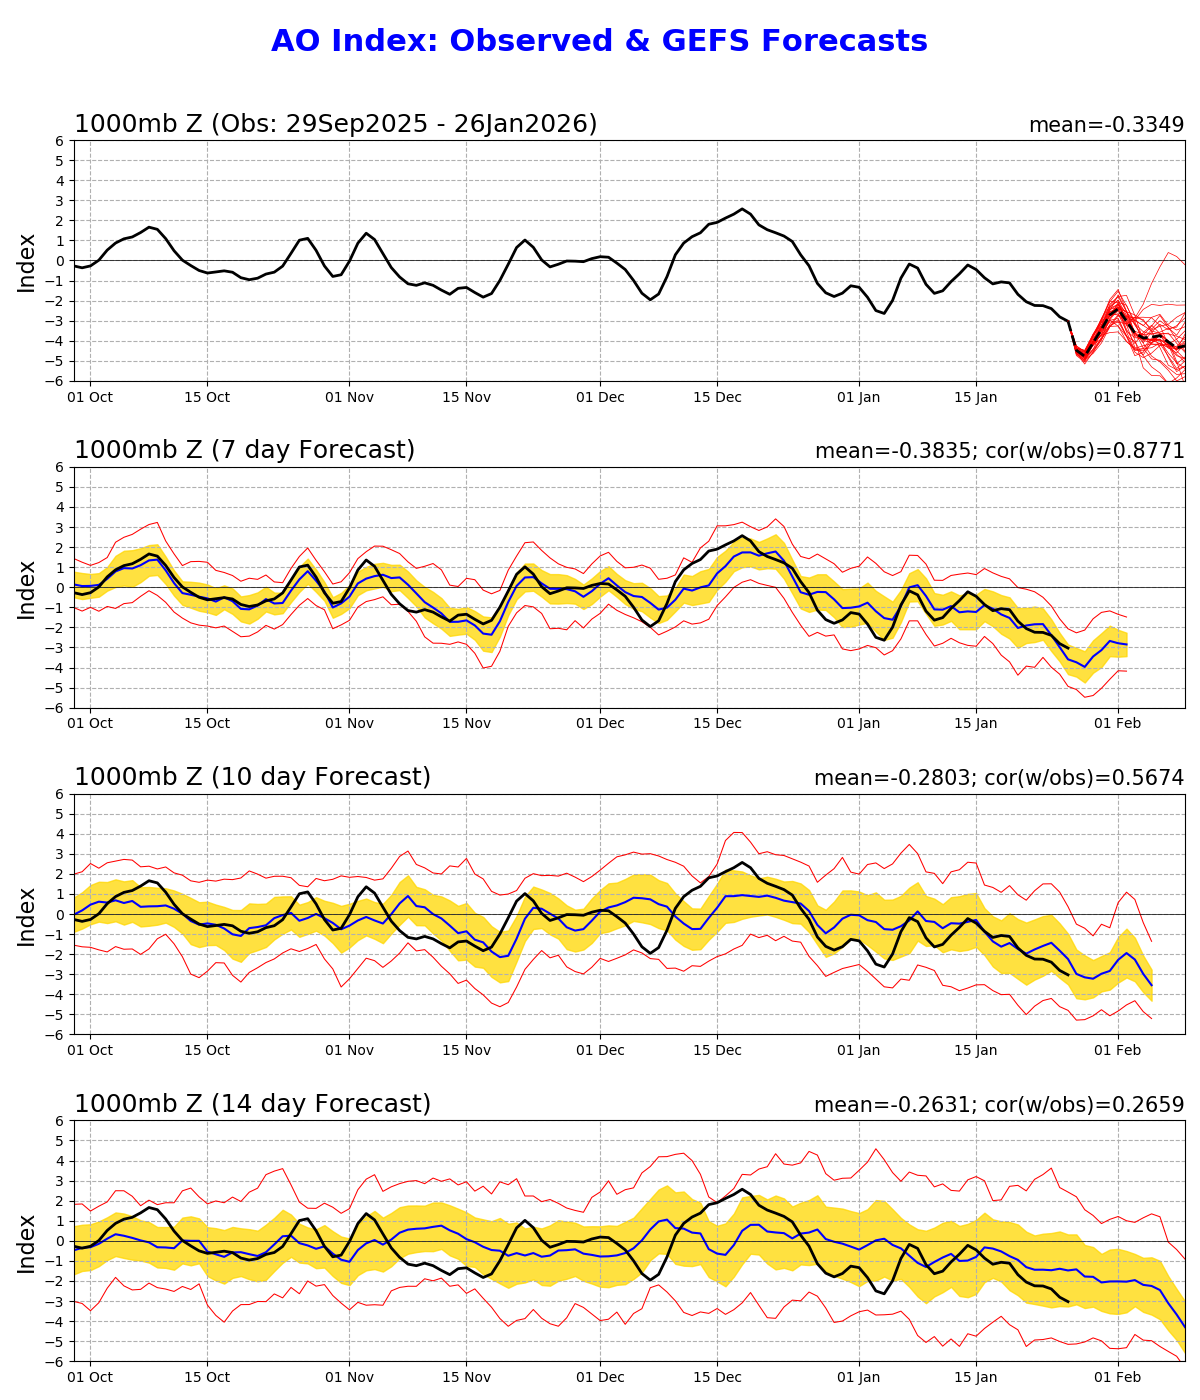
the AO trending neutral at the end of the month is likely the main contributor to the return to warmer temps. At the moment I would discount the climatological rise for the second half of Feb for the moment given the more recent, albeit speculative SSW forecasts ..
Holding fairly steady, so I don't understand what polymarket is up to... looks quite a bit mispriced for the last few days ... Maybe someone has developed a better model based on the incomplete data to be expected and how it will bias? That or the biggest bettors are leaning heavily on a statistical model? The latter seems unlikely based on Polymarket's track record but I don't know who is responsible for the current pricing....
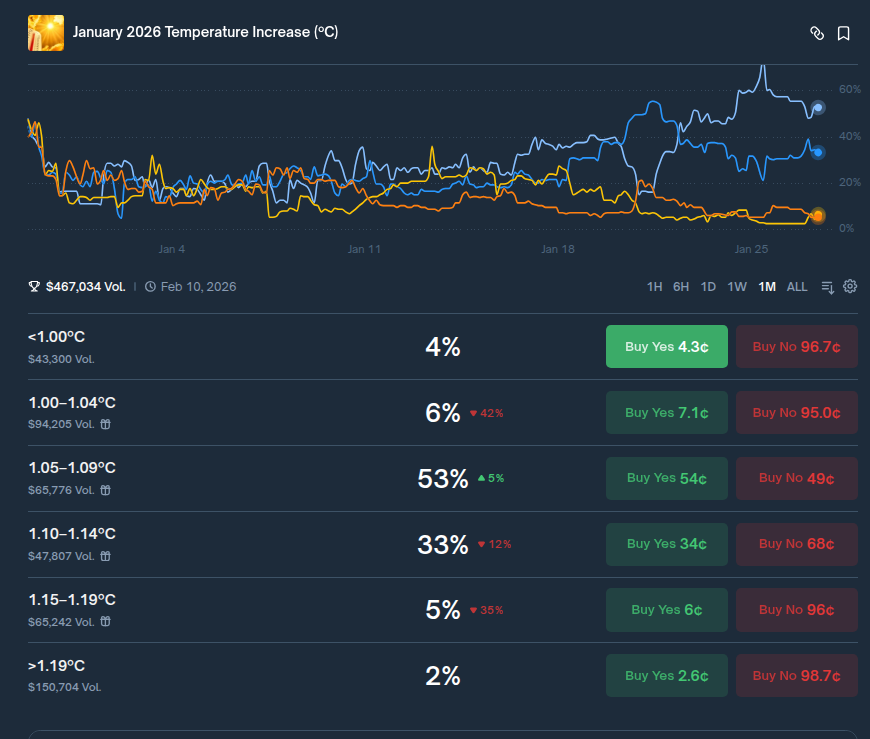
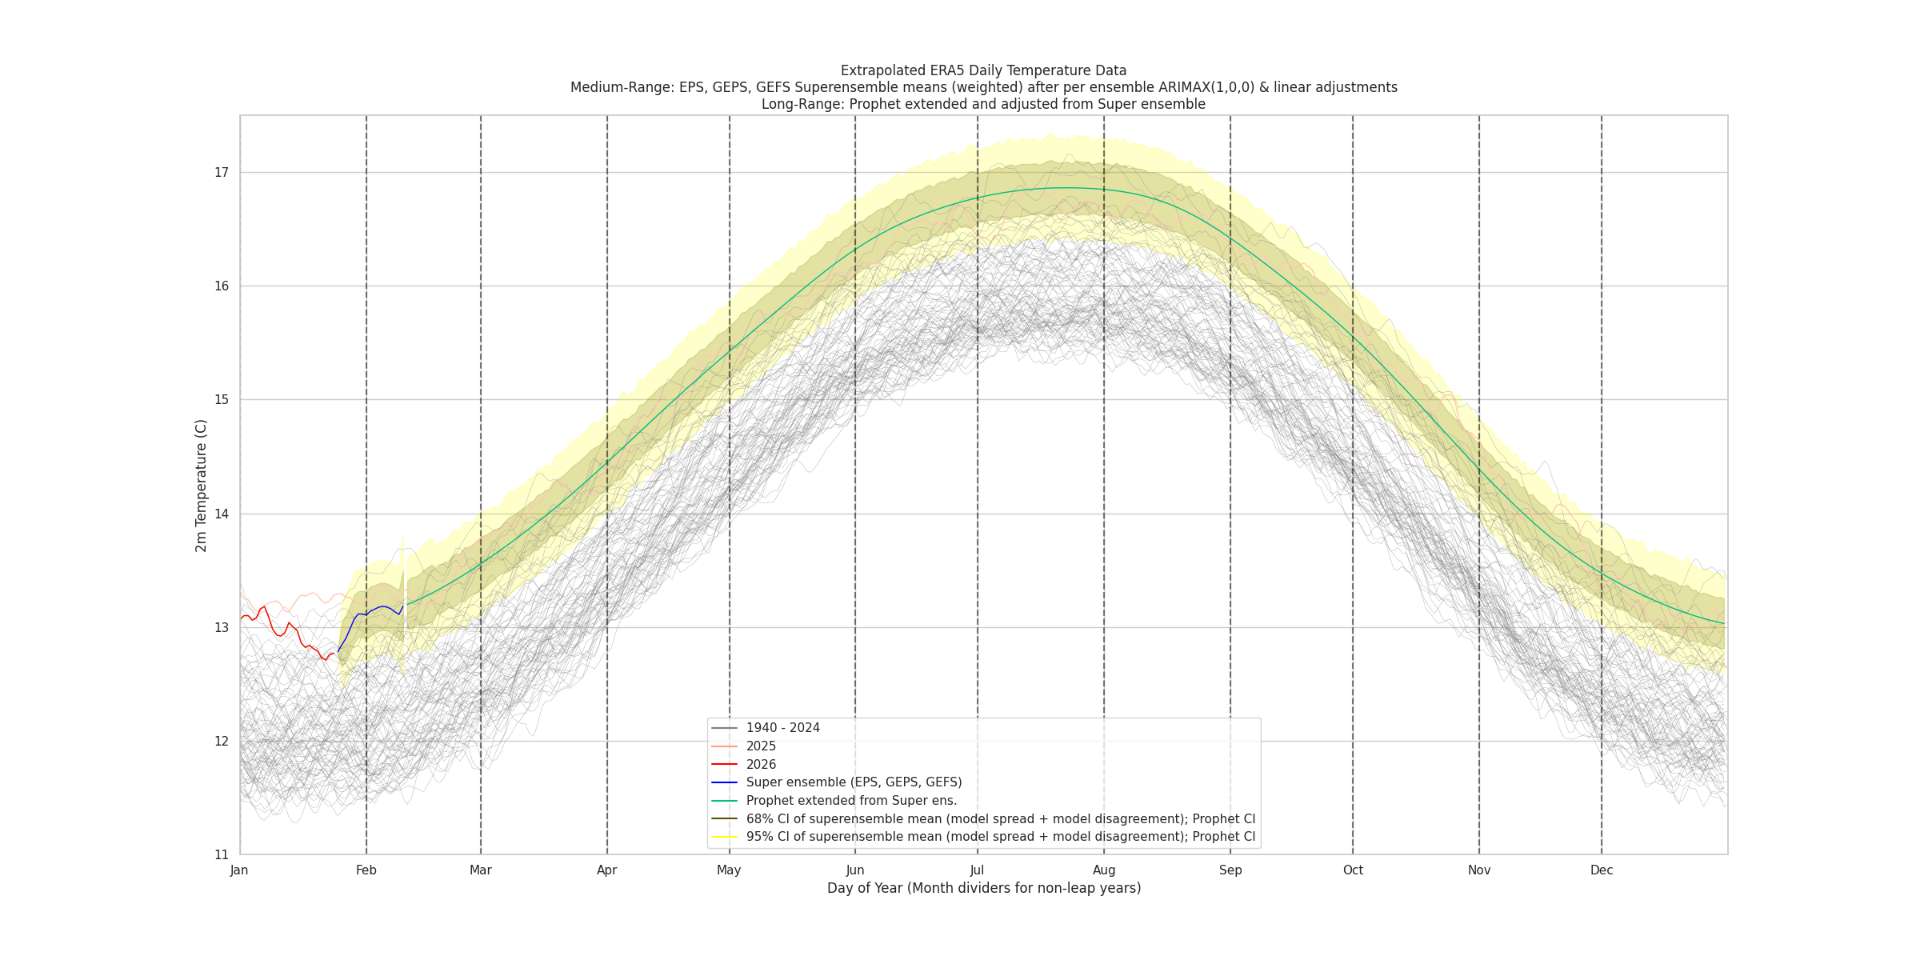
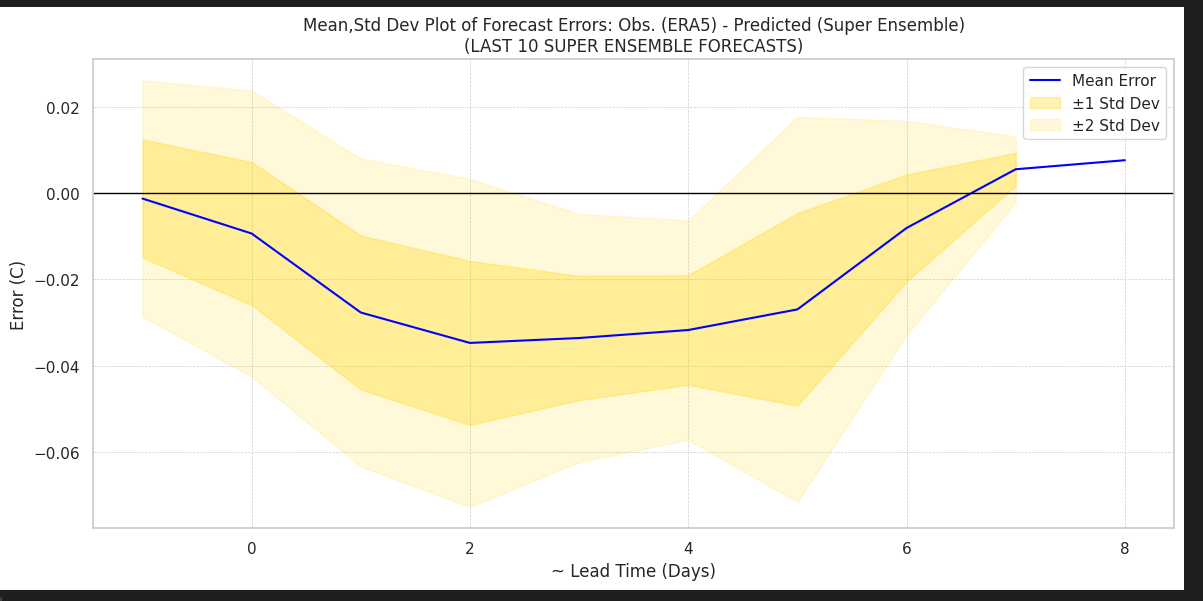
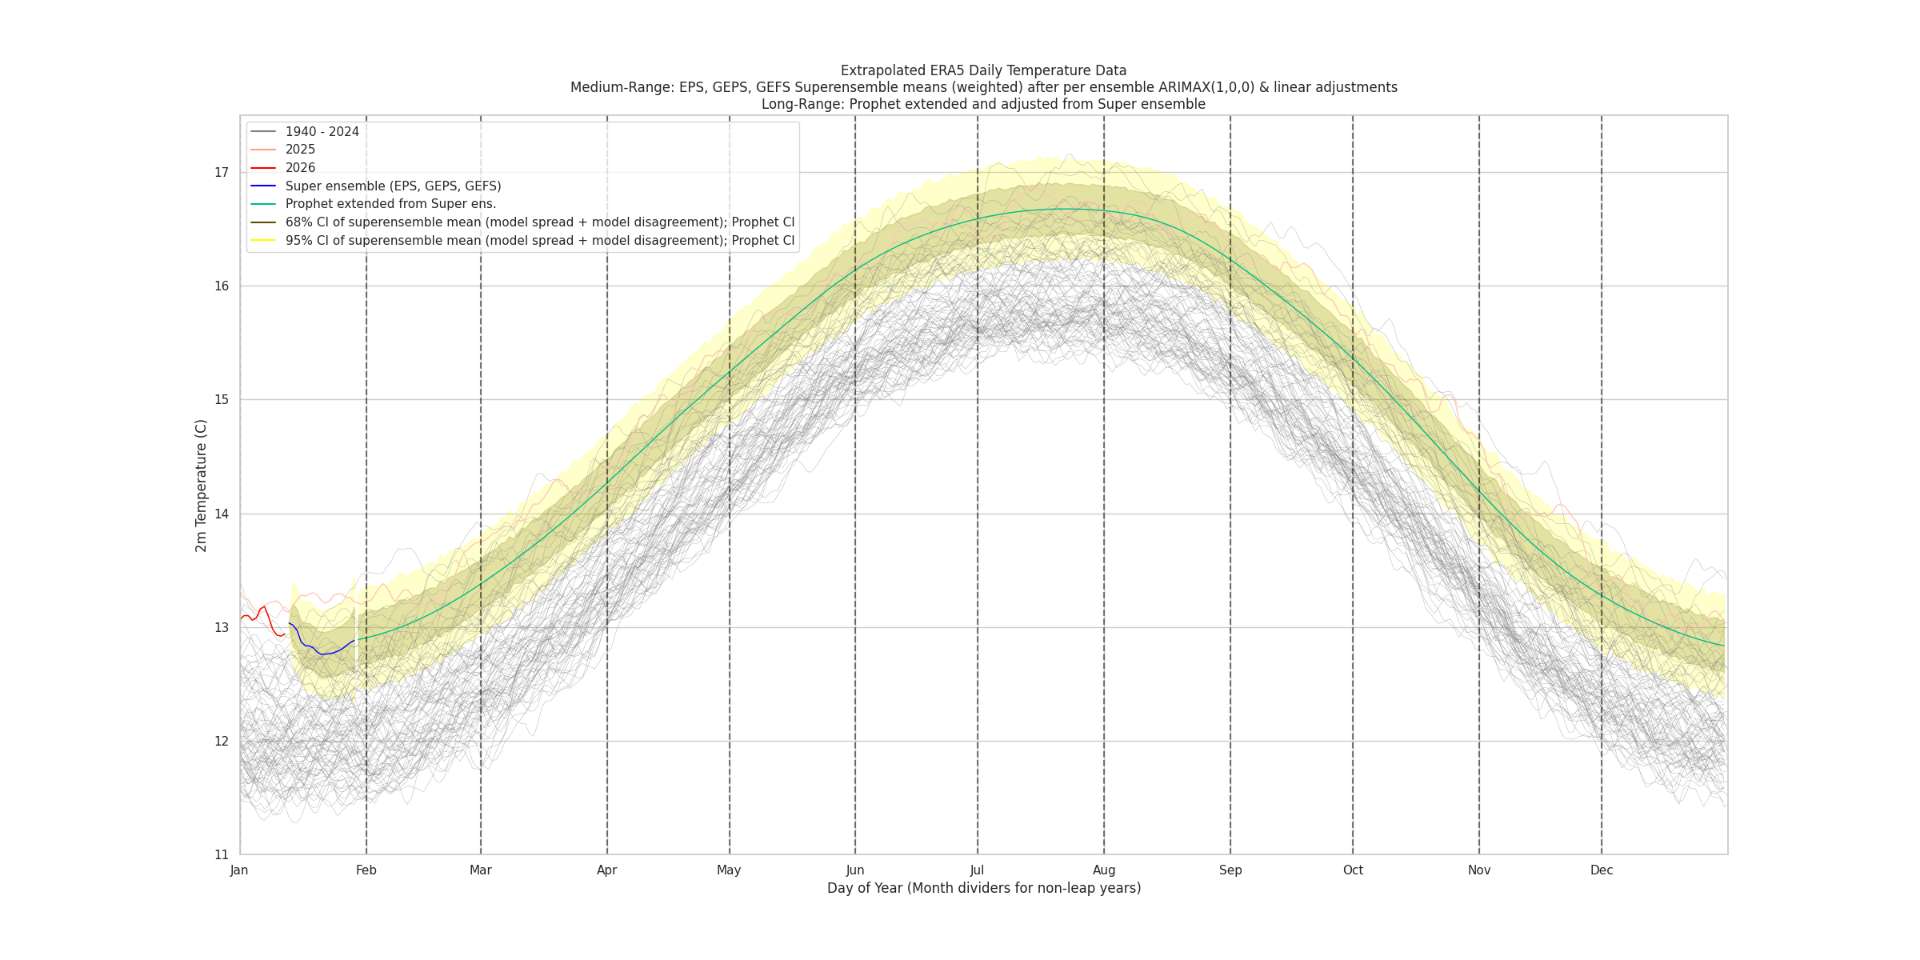
Recent errors for short lead times for the superensemble haven't been particularly bad. With 6 days left, despite models being on slightly the warm side (fairly usual performance), even a average daily conservative error with respect to ERA5 of -0.03 wouldn't amount to a change more than -0.03*6/31 ~= -0.006 C, which wouldn't anywhere near account for the discrepancy between our center point predictions and Polymarket's implied one.
Final ERA5 data is in last night, so for my ERA5->GISTEMP prediction (adjusted) is 1.128 C (1.114 C unadjusted).
Edit (gfx to 31st): Looking at the ERA5 anomalies .....
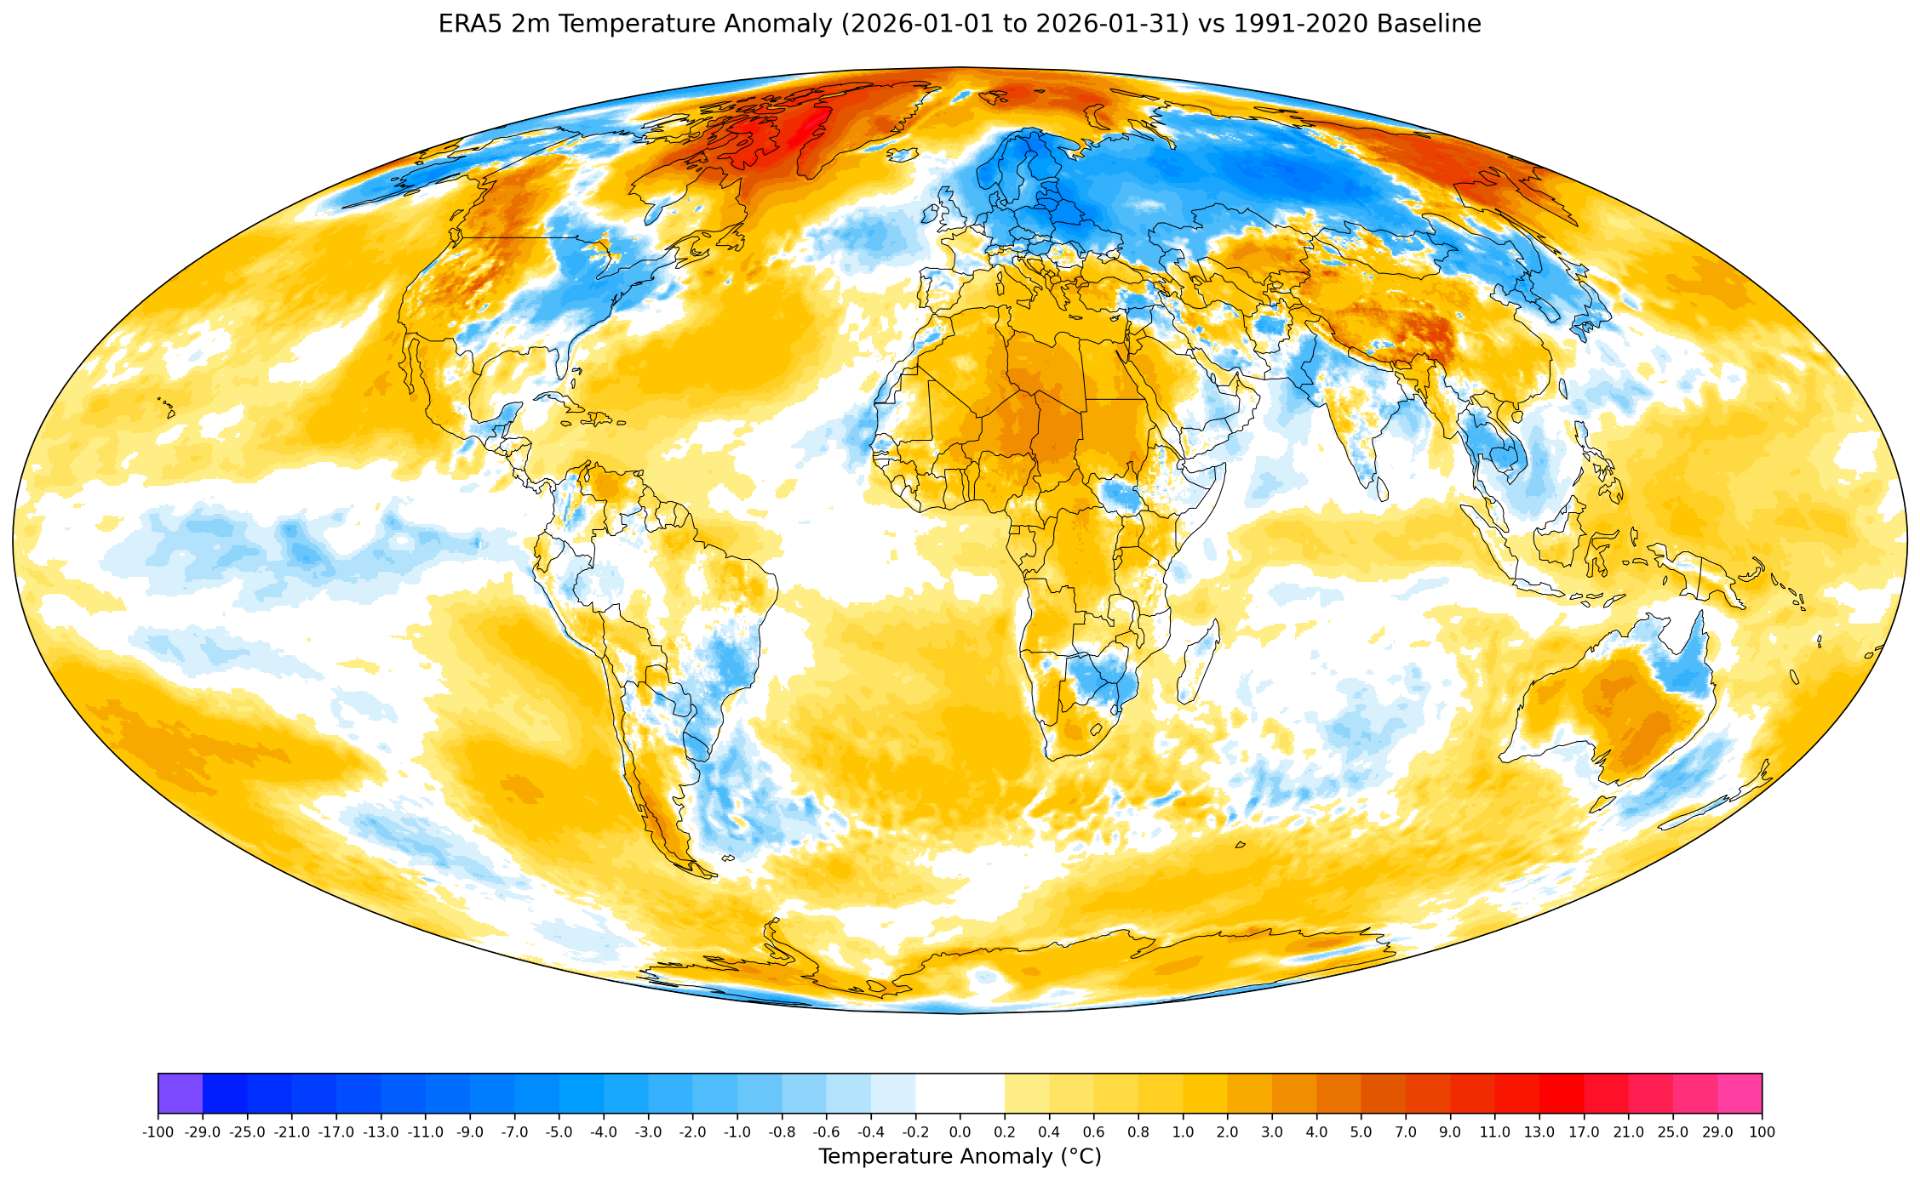
ghcnm data that could be late based on the past few months where it has been erratic that could cause it to be lower would be China and Svalbard & possibly Jan Mayen as it seems would likely be infilled with less anomalously hot temps.
Given that I've noticed a pattern of more of the central Antarctic stations showing up later then the coastal ones I don't think this will cause it to drop down and actually might contribute slightly warmer until they do. China is the biggest risk though.
Given the disagreement with polymarket, I went back to the predictions I've made in the last year or so as well:
Last year, the error for my January 2025 prediction with the linear model was 0.00C (this was before I started collecting unrounded decimal data from gistemp).
Considering that currently the mean bias that I use to adjust my prediction is 0.014, I should probably expect the final temp to be between the unadjusted and adjusted prediction I made (and similarly for the probabilities; I calculated this time two sets for both -- that is with and without the adjustment), and thus I adjust my bets now splitting both (the probs for the bin below,above the main bin just end up swapping probabilities since the center is close to the middle of the bin, which results in a symmetric dist. when taking the difference).
Given all of the above I take the probability for the central point to be somewhere between 16/18 (the number of predictions I considered decent / total predictions) of the way between the inherit probabilities you could derive from gistemp alone and my own forecast errors (which would put it at 62% instead of 64%, and then reduce it slightly further based on China, etc (perhaps I should have reduced it further than 60% but I am hopeful enough that the necessary data will be there this month by Jan 9....).
More notes for self regarding the two large misses last year (Aug. and Sep. 2025):
In 2025 though there were two months that were outliers -- August and September; even using more up to date data for those errors they still significant outliers (0.123 and 0.078); I switched to a per month linear model more than a year ago rather than switch back and forth to a yearly model depending on the scoring (i.e. significant p-value) as it seemed more worth it subjectively, however even taking the linear model correction for August it wouldn't significantly reduce the error (perhaps down to ~0.10). September does have a significant p-value so the large error is still unexplained. I thought some months ago perhaps this error would go away with more data, but now with only ~400 less stations (9466 vs 9883 compared to last year when going by those with enough data in common with 1991-2020 baseline) it seems this isn't the case. This only means there is still some significant bias/variance between datasets remaining that needs to be adjusted for to go beyond the naive, linear ERA5->gistemp model -- this is future work I've put off for a long time. For reference January monthly model is a good fit as well.
For all other errors I use the unrounded value at the release date, which gives this past history of errors:
array([-0.02 , 0.01 , 0.03 , 0.01 , 0.02 , 0.03 , 0. , -0.01 , 0.021, 0.052, 0.004, -0.013, 0.053, 0.123, 0.078, 0.005, 0.011, 0.02 ])
For the time being I've removed them (bolded) from the calculations as outliers until I can do enough research to come up with a robust improvement to the linear model.
@Rhhgdd the ERA5 data was finalized yesterday morning so my numbers are already final from that. Feel free to bet the lower bin up more if you want ...
In other news, still no ghcnm revision yet today for Feb 4 (its usually out by now, but it could come later...)
@Rhhgdd no official schedule but yes (barring data problems!!; from my understanding H.R. 6938 passed with strong support and should be signed by Trump next week I guess? So they shouldn’t affected politically by any February shutdown which is in the 20% ish range?)
Last month the superensemble did exceptionally well as far as consistency (a std dev 0.016 over all daily center point predictions made from Dec 3-), especially considering I'd rank December as the 4th hardest month to predict for these type of questions (i.e. Mar, Jan, Feb, then Dec).
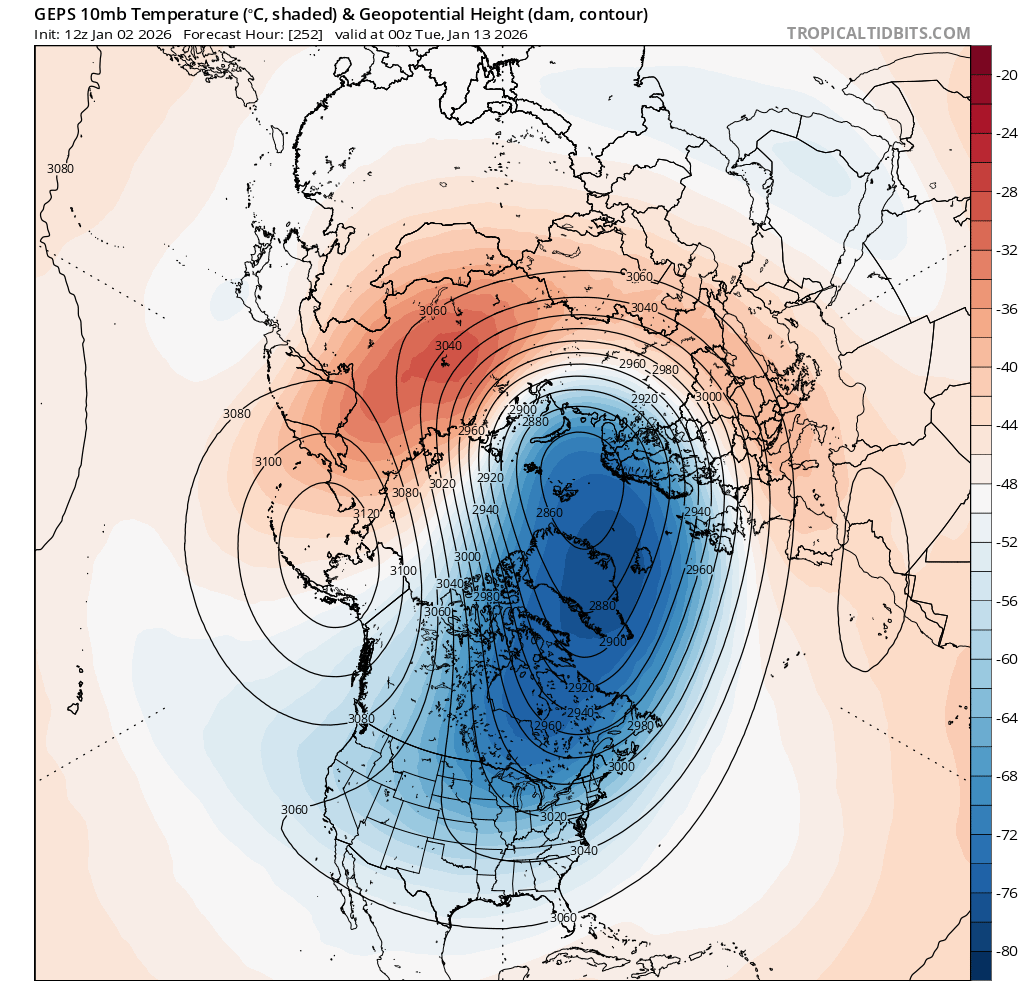
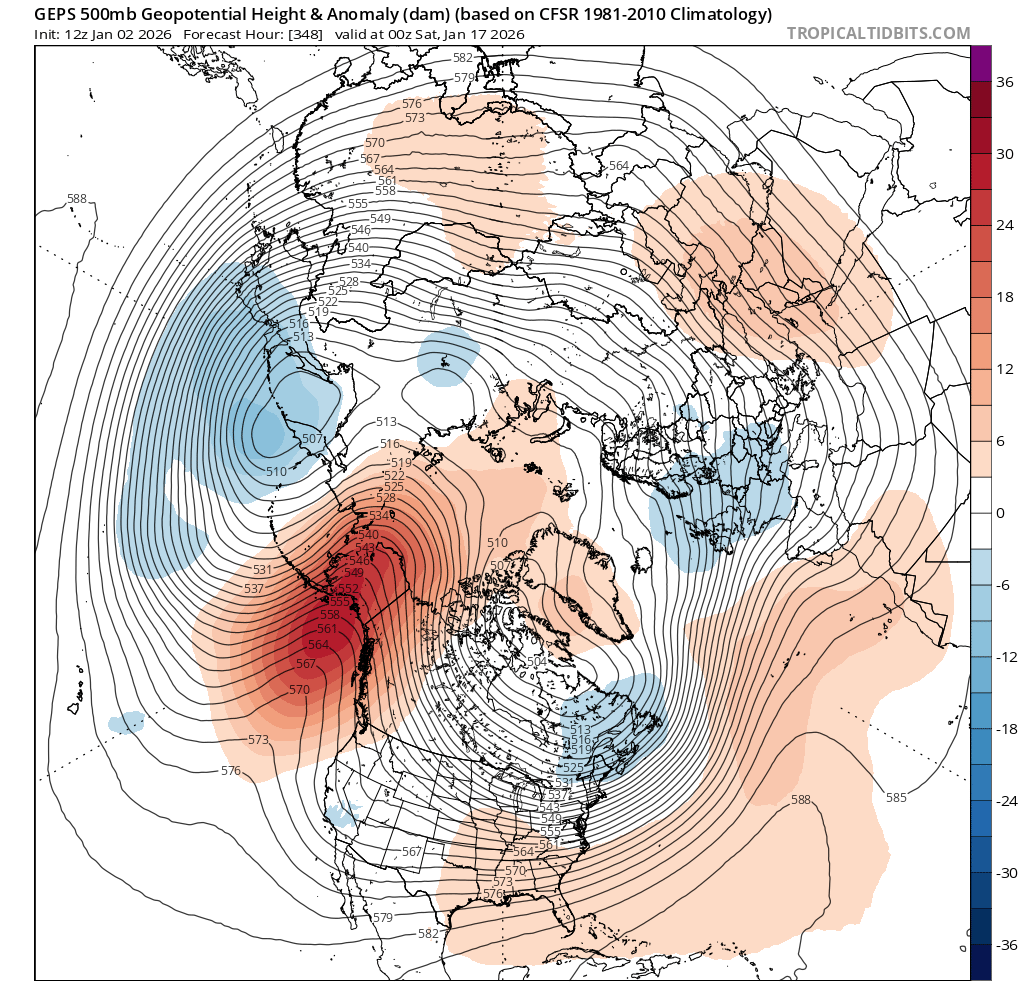
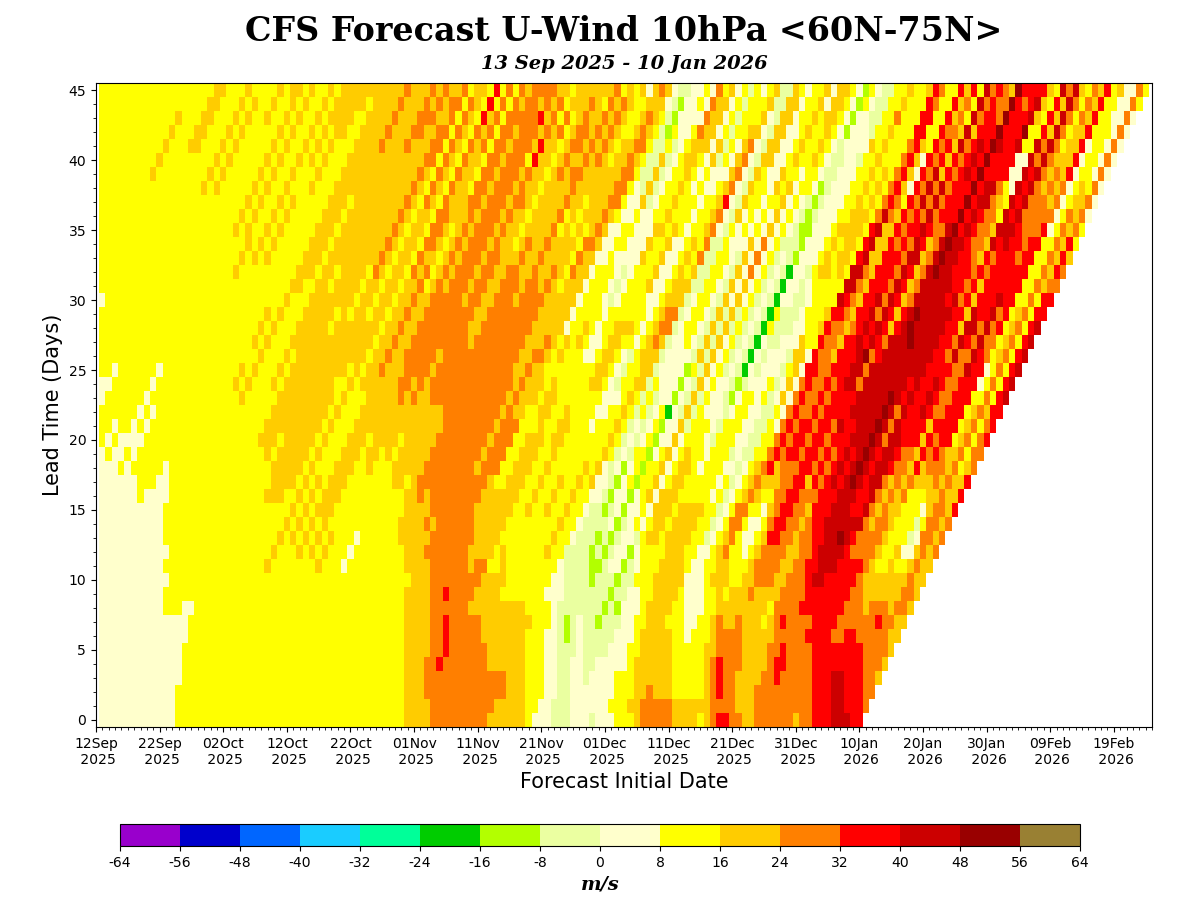
Based on my own outlooks from looking at forecasts for the last month I'm going to speculate and say most of this predictability was driven from the abnormally warm November temps in the NH coming into December, and the stability that it bought as far as in the NH decreasing the chances of disruptions to the jetstream (strat. polar vortex only stretched/displaced and didn't split), with less, and shorter blasts of Arctic air. Hard to say if it will continue, but it looks like for now its more of the same for January so far based on the ensembles, with a repeat of a stretched/displaced PV at the moment.
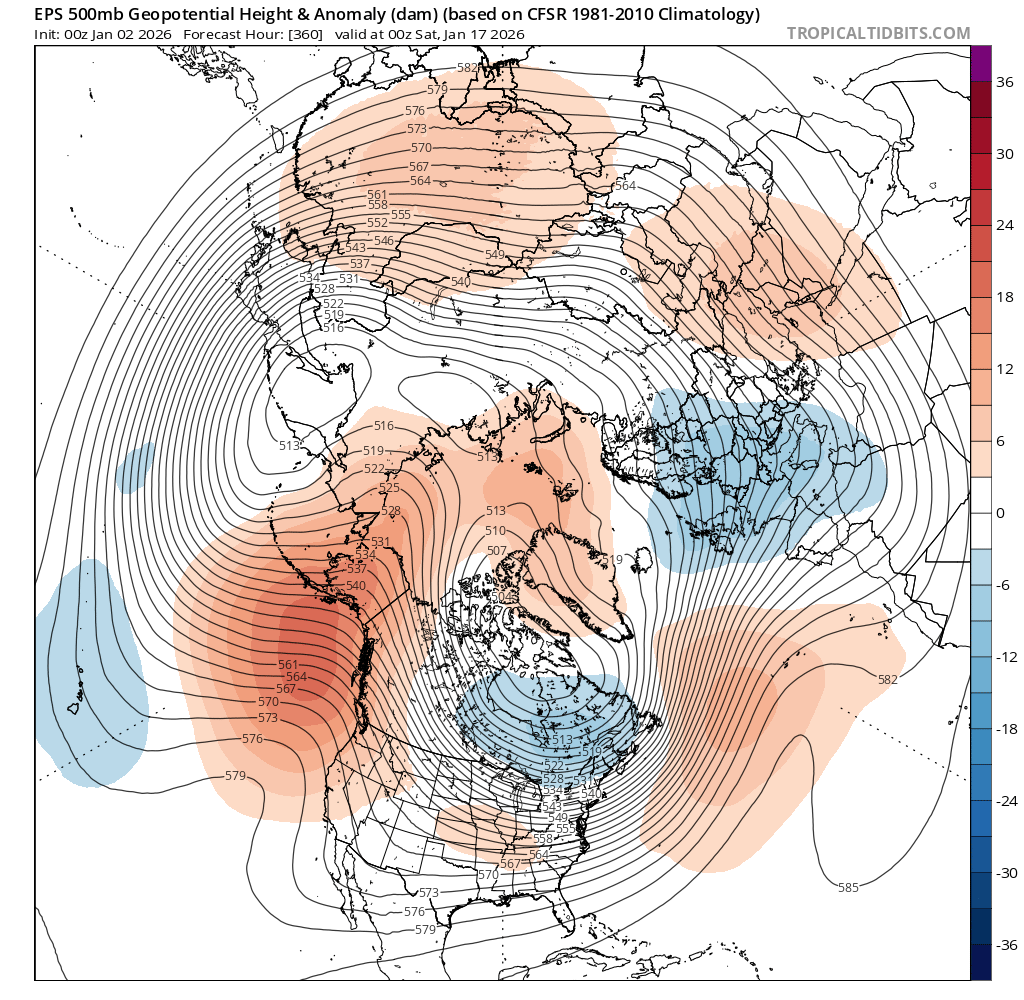
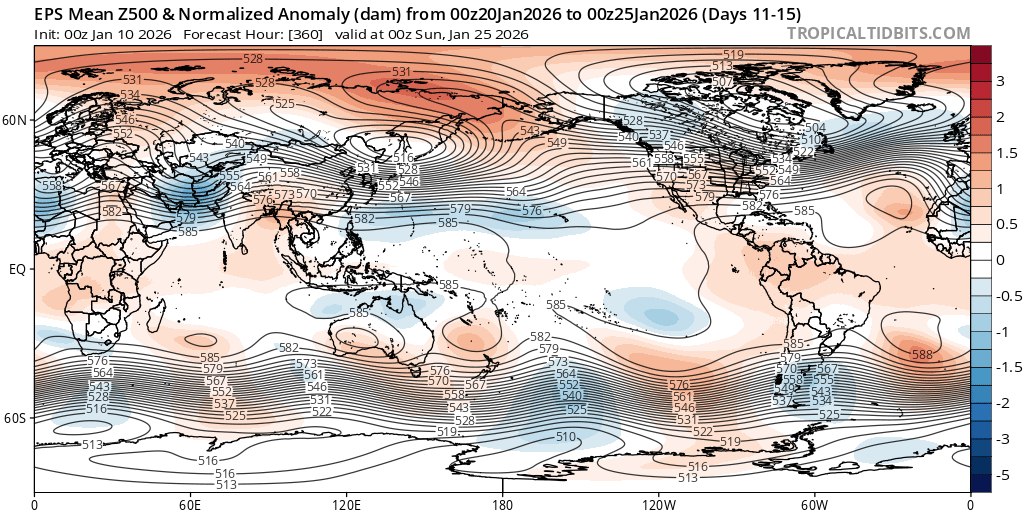
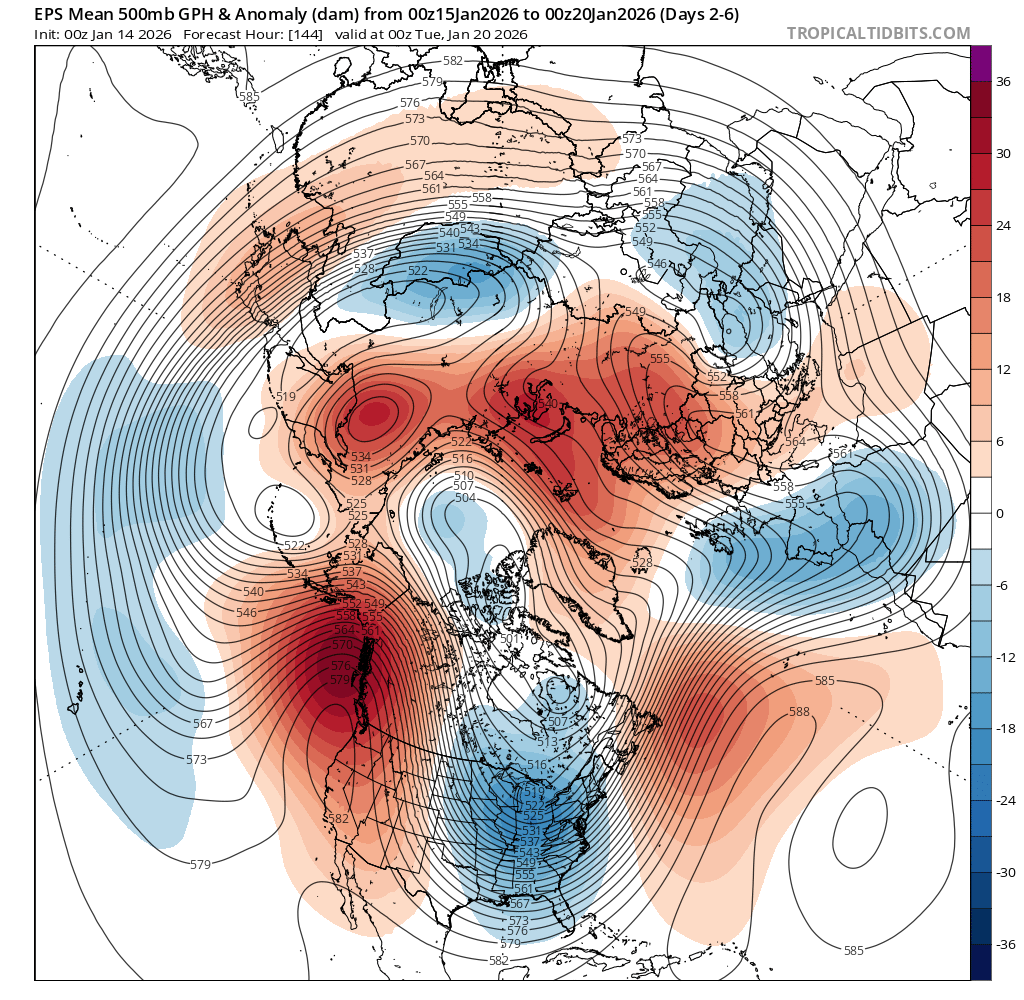
I take it as a good sign that the mean anomaly EPS/GEPS generally agree on the 500mb setup for the NH at the end of their forecast, even if there is likely quite a bit of variance within the ensemble (looks like more in EPS than GEPS).
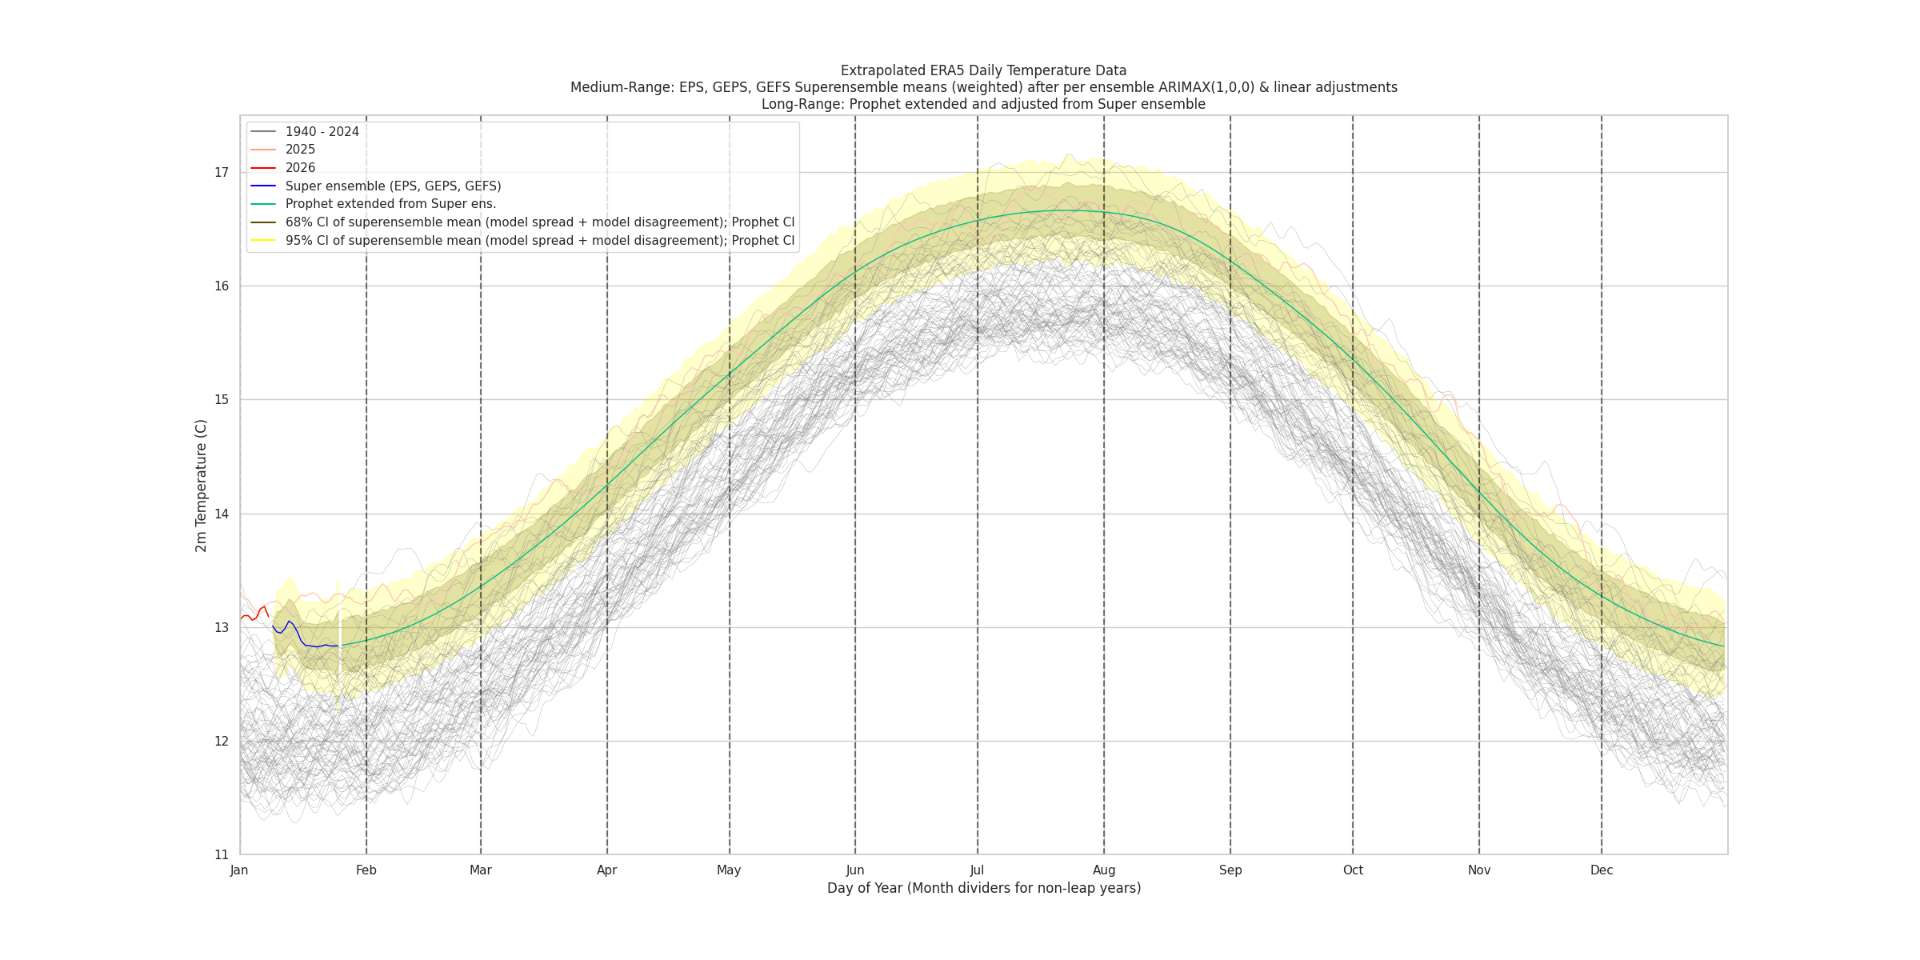
Per the superensemble, if its anything like the last couple years and with a El Nino predicted, we might reach the minimum for 2026 before the middle of January.
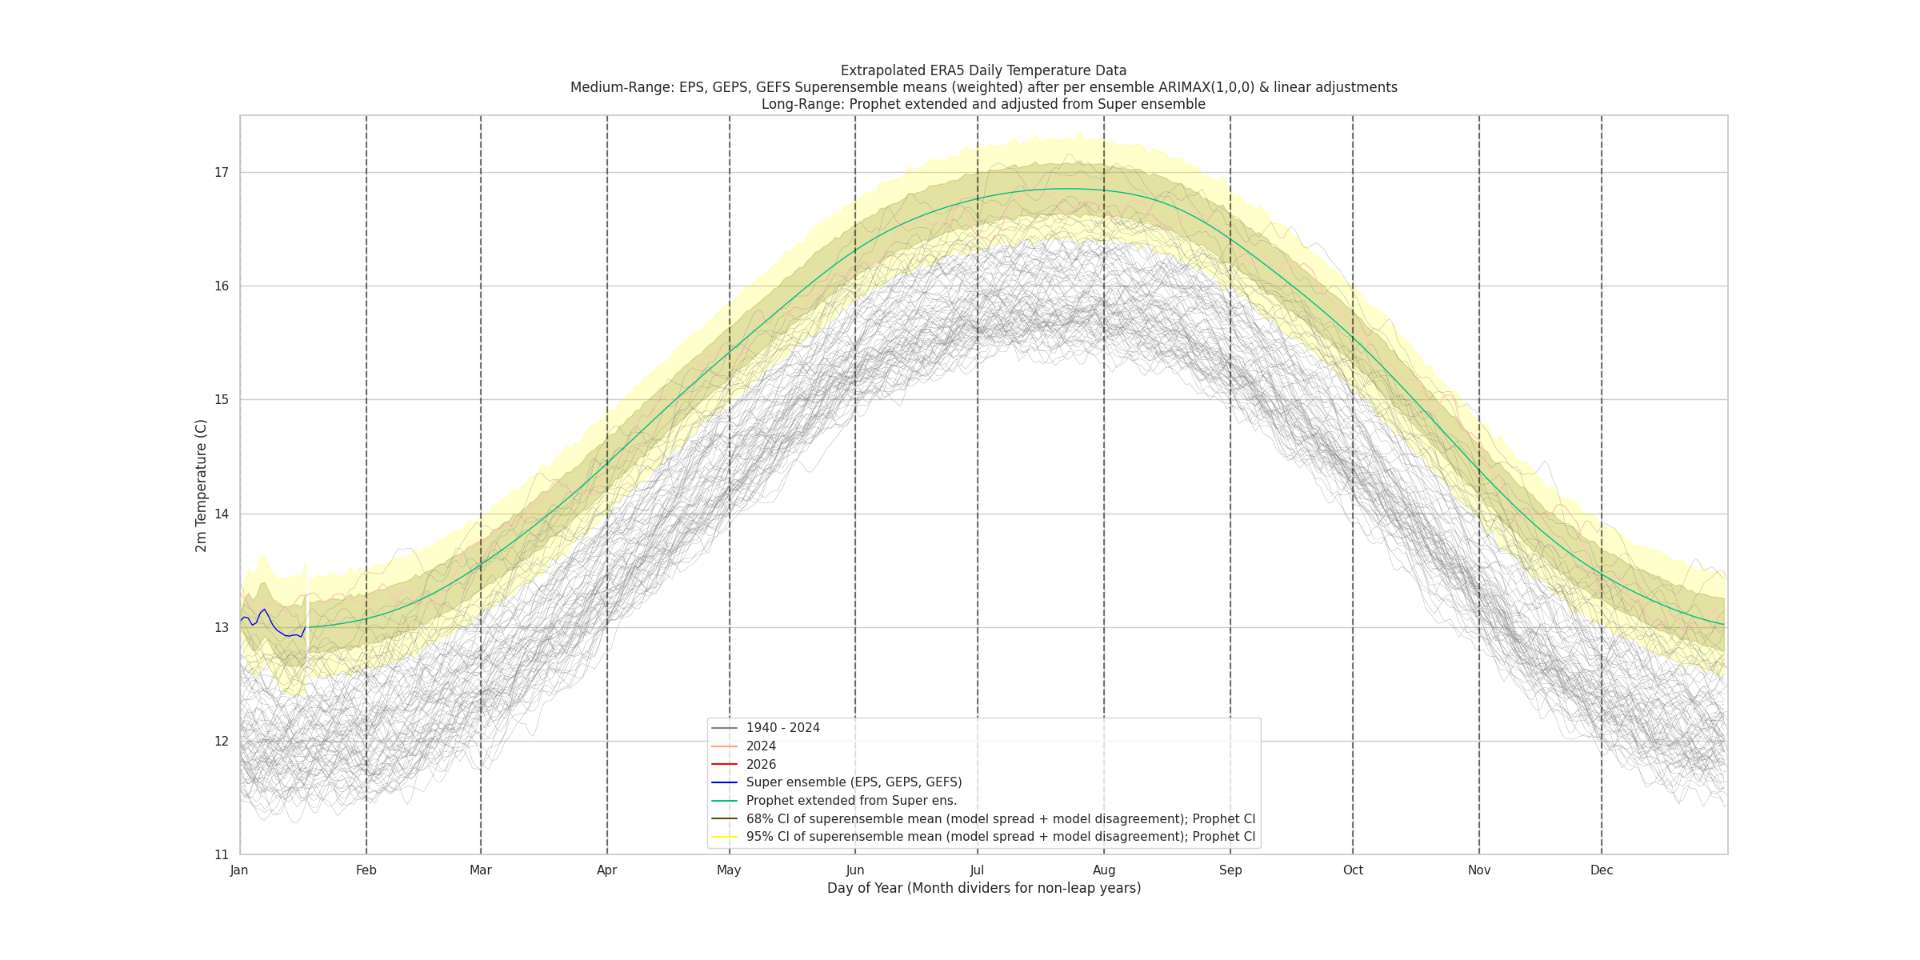
Not had great consistency between runs in the ensembles, and my estimates for Jan's temps have mostly trended downwards since the beginning of the month (by about 0.025 C over the last 7 days) as the mid-month dip has deepened and continued to remain flat for an extended period.
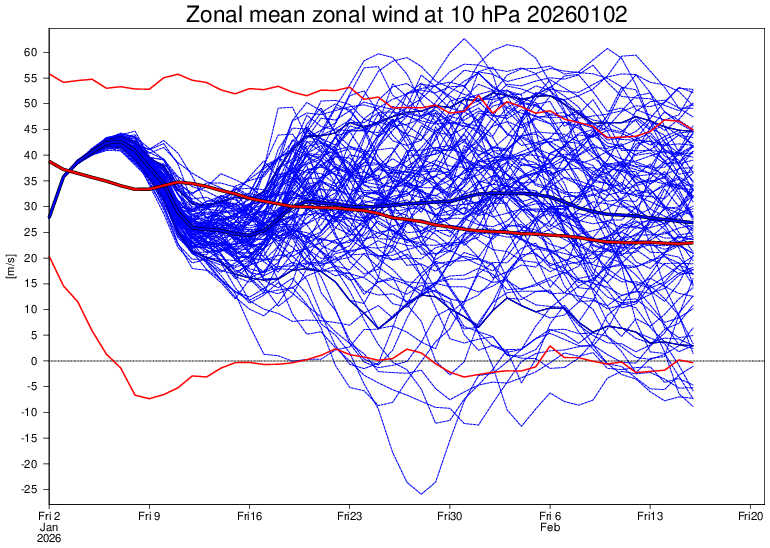
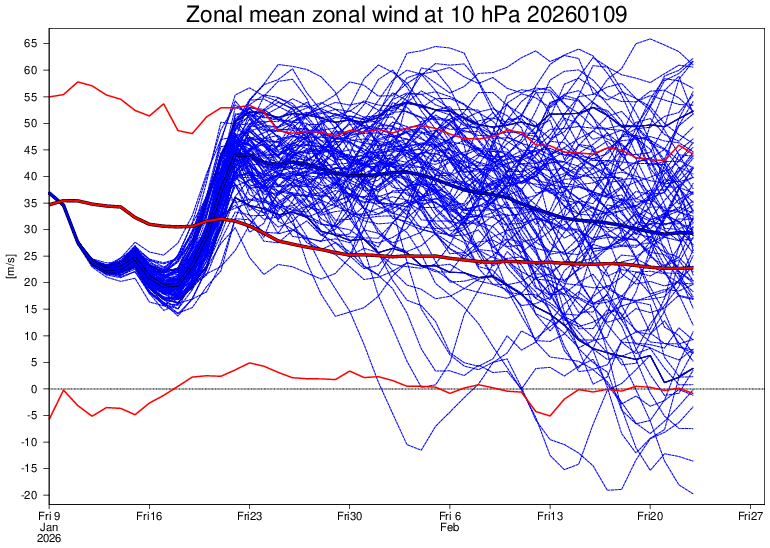
The polar vortex starts getting disrupted and stretched over the next few days, but its supposed to strengthen back to above normal before the end of the month ..
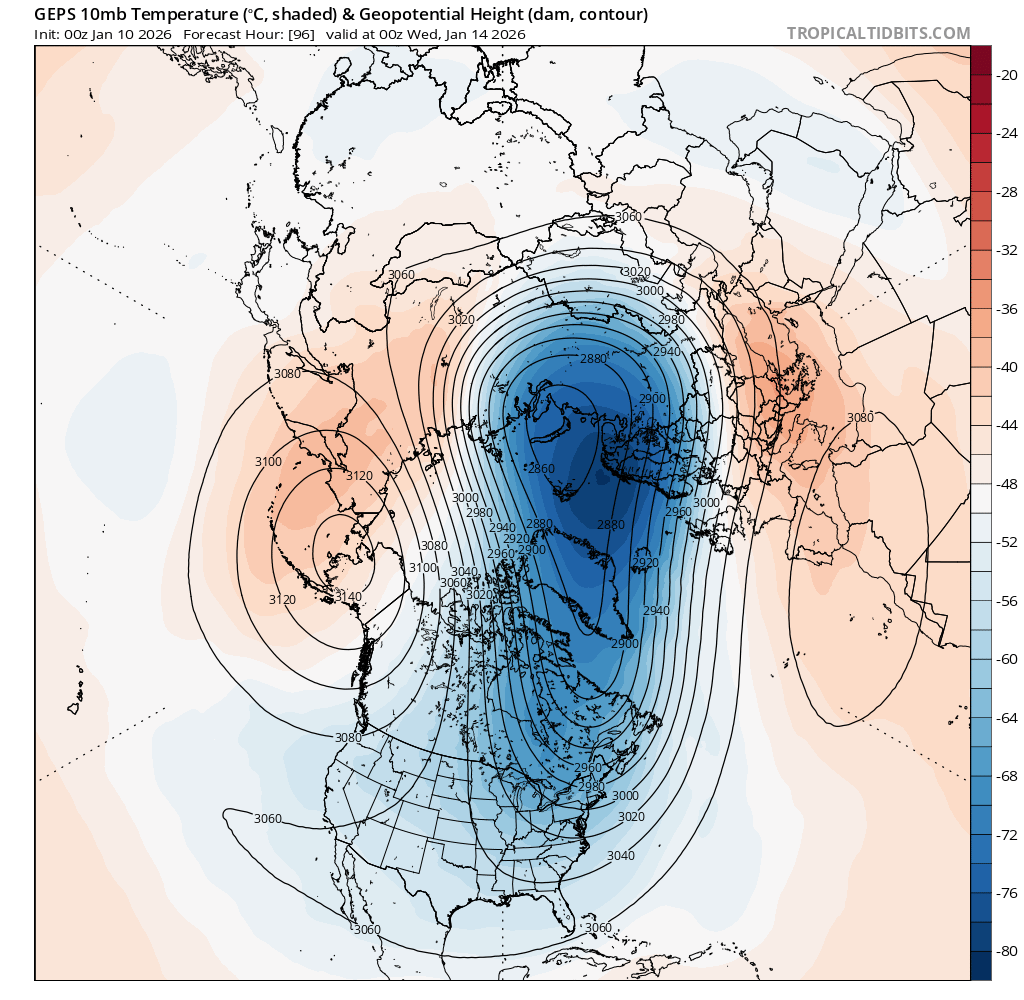
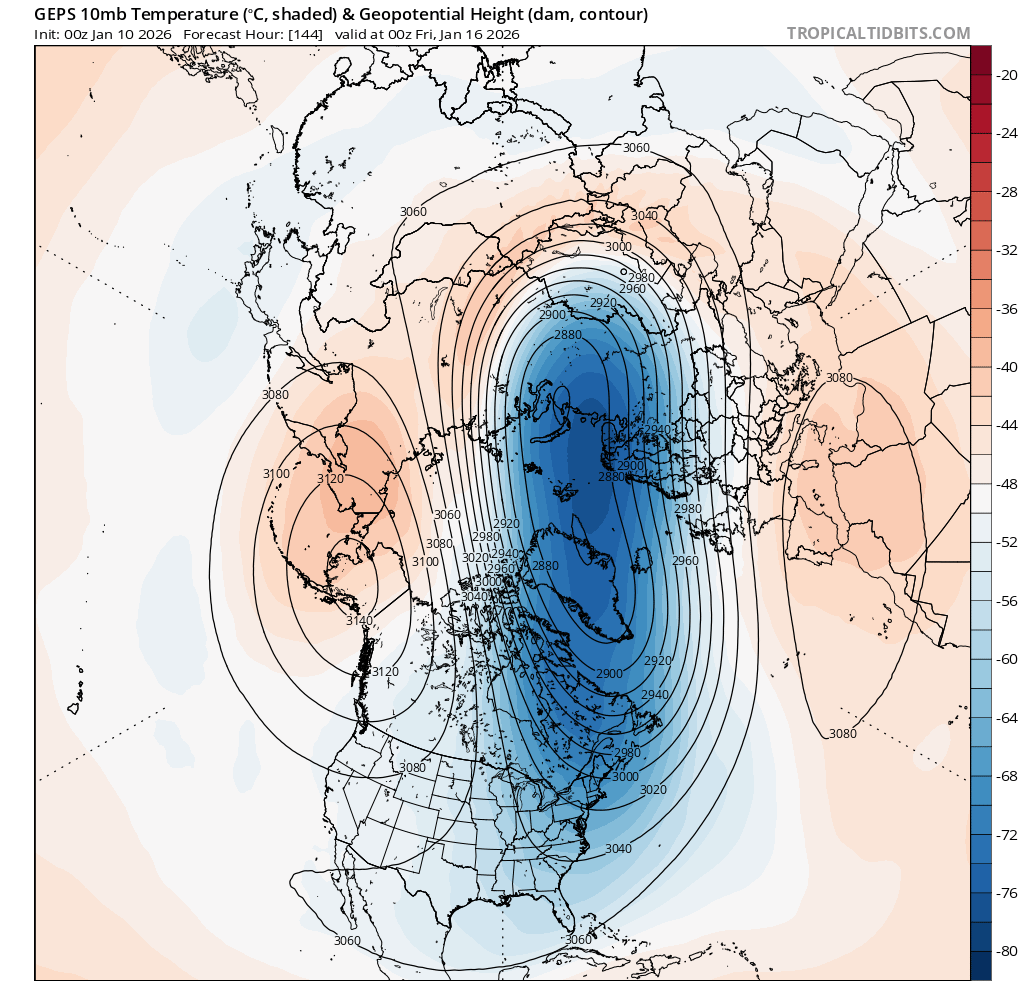
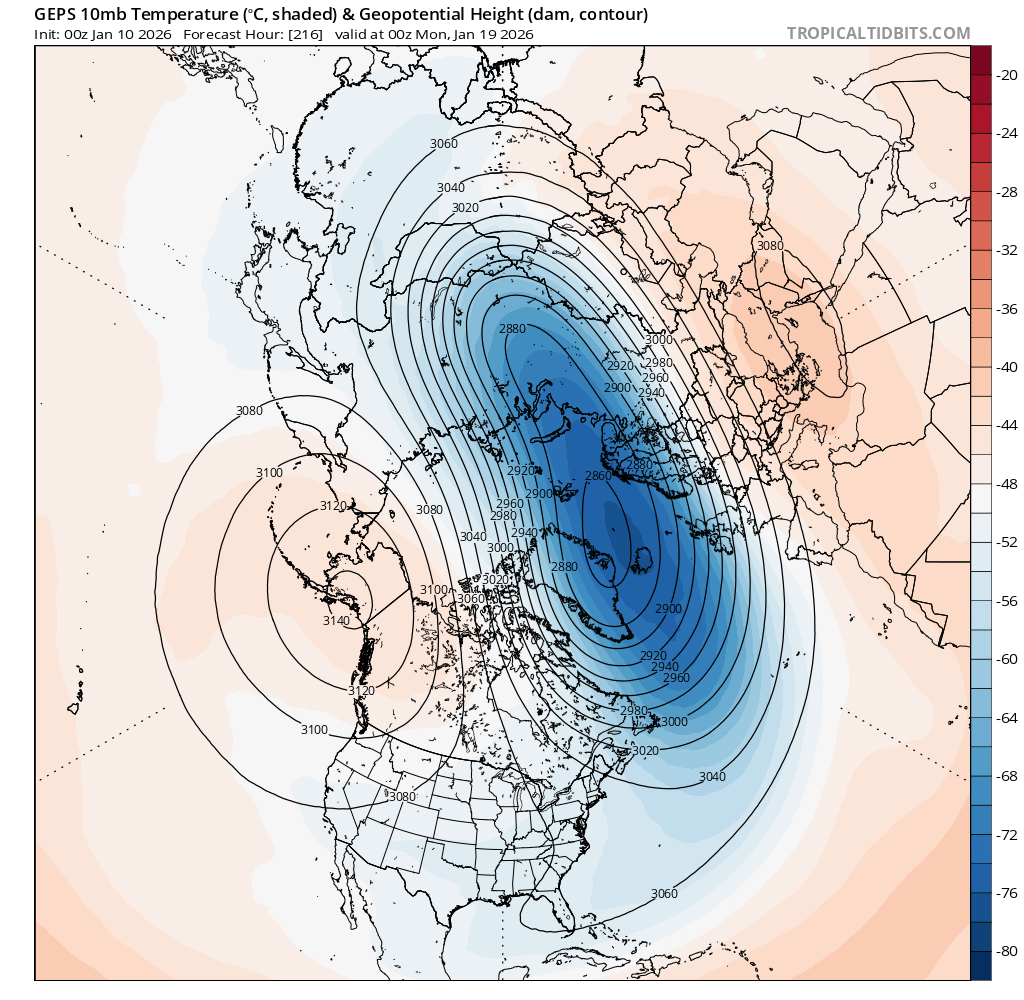
Looks like it will return to normal around the 21st...
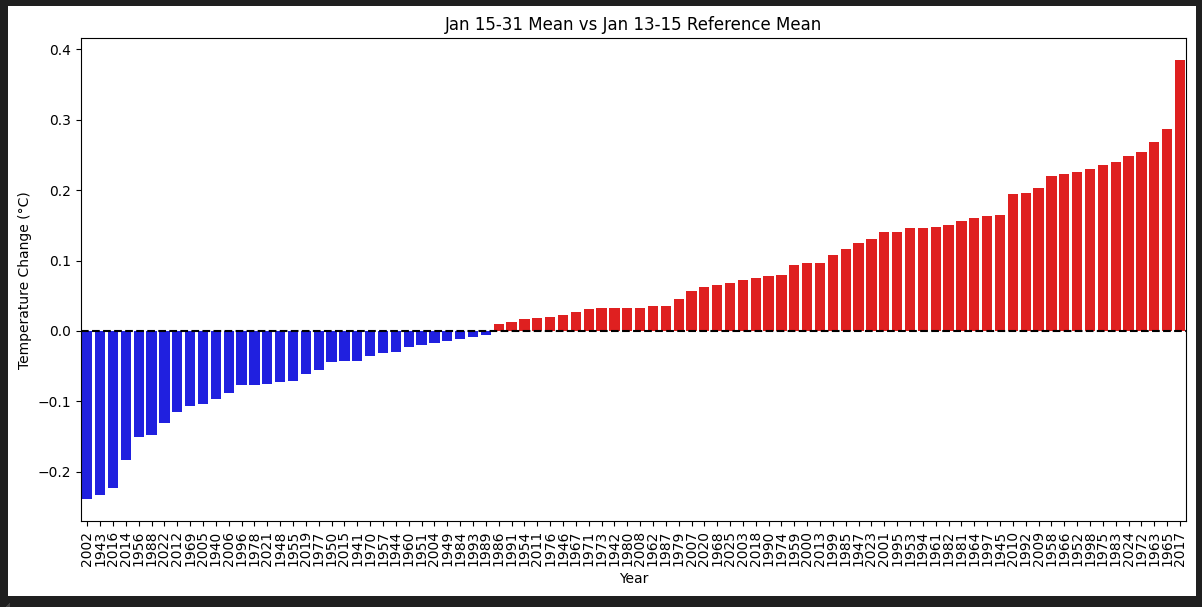
Based on climate priors for January, should expect some small warm up for second half of month, but given that week 3 is flat at the end of the medium range ensembles this doesn't look it's going to be the case this time....
2011 was closest recent prior for Dec 2025 that also had a small warmup, but at the moment 2022 looks like a closer analog for Jan given the medium range ensembles and the state of the La Nina, especially if the vortex becomes stable again as forecast.
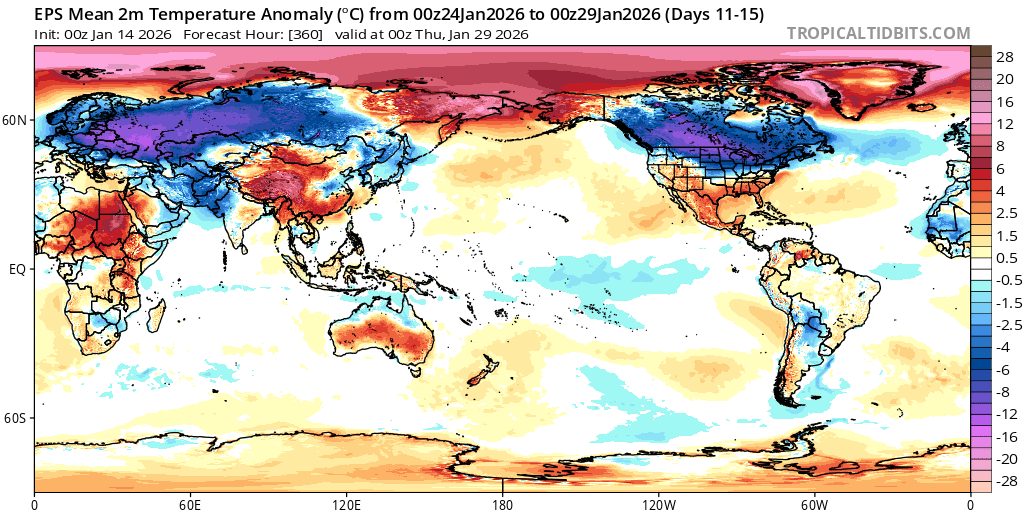
EPS/GEPS are showing greater cold anomalies across Siberia from this scenario with more stability shown starting week 4 of Jan...
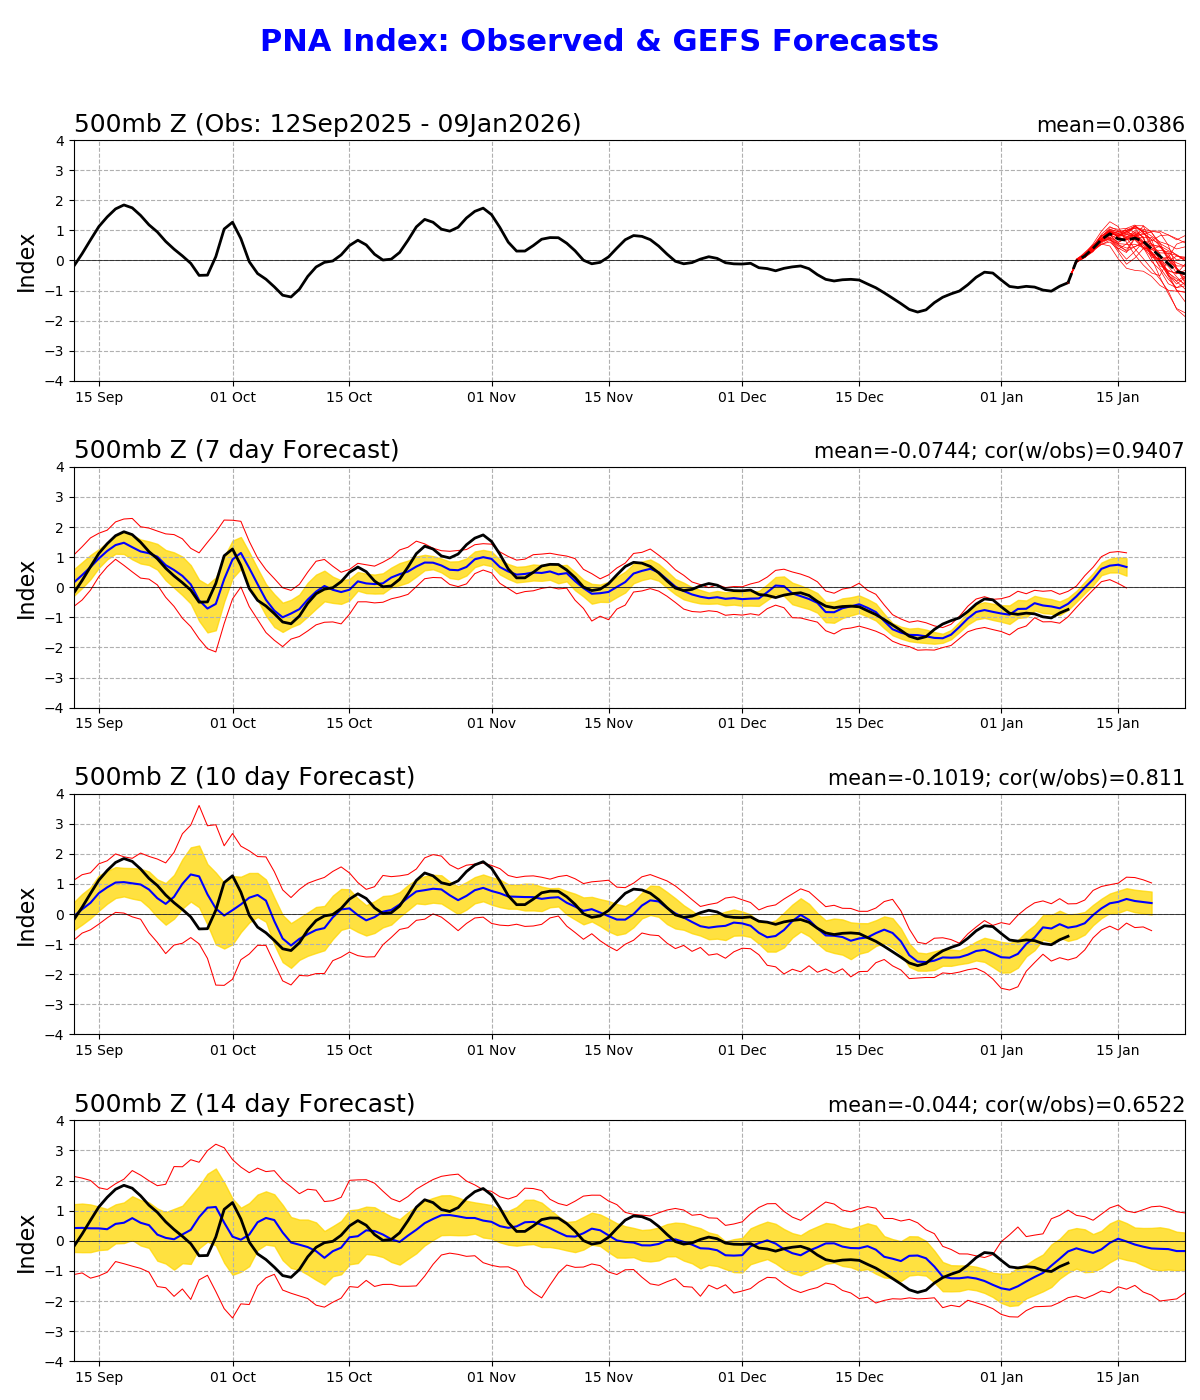
Not alot of strong agreement though generally within the ensembles, as the PNA becoming neutral though at the end of week 3 in GEFS indicates its going to be hard to say how much of the cold weather will remain locked up in the Arctic for the end of the month for North America... However continuing my aim last month to be more agressive earlier on in the month I'm going to lean more aggressively now towards what the medium range ensembles are pointing towards at the moment.
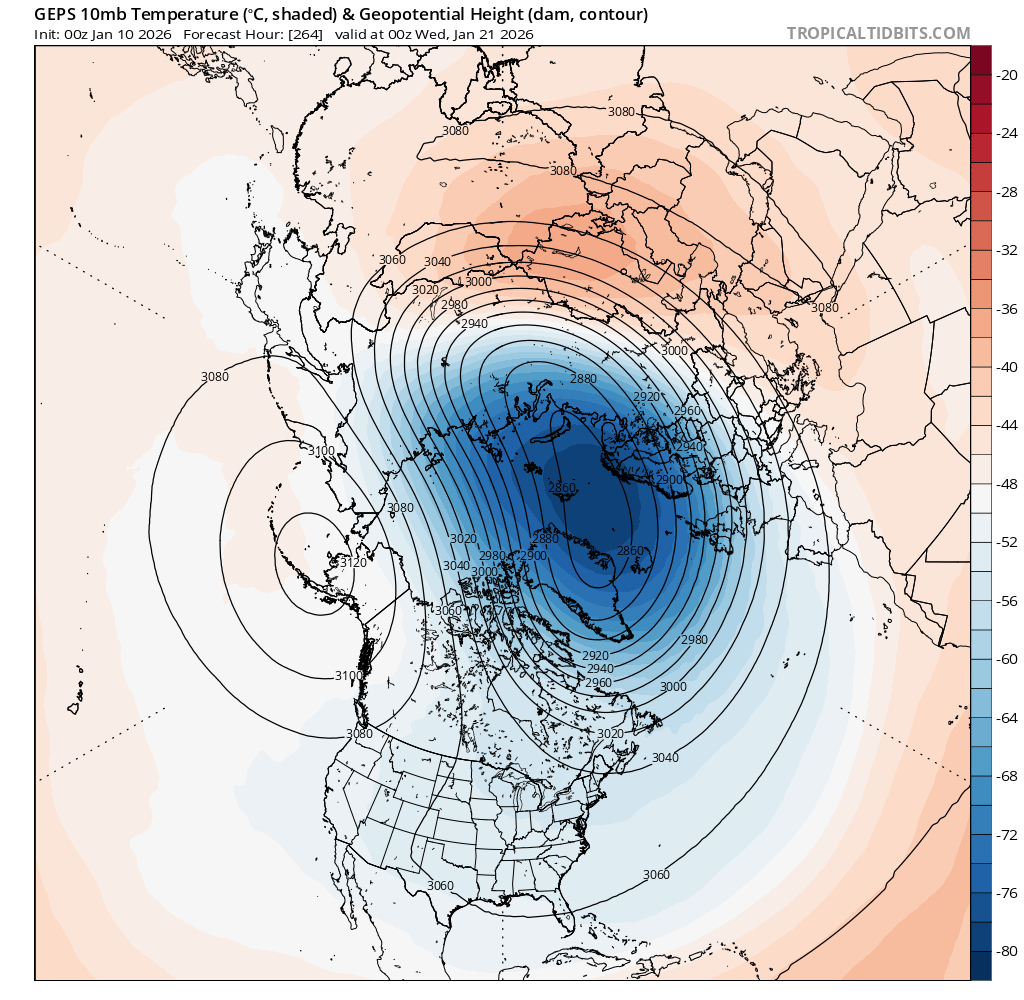
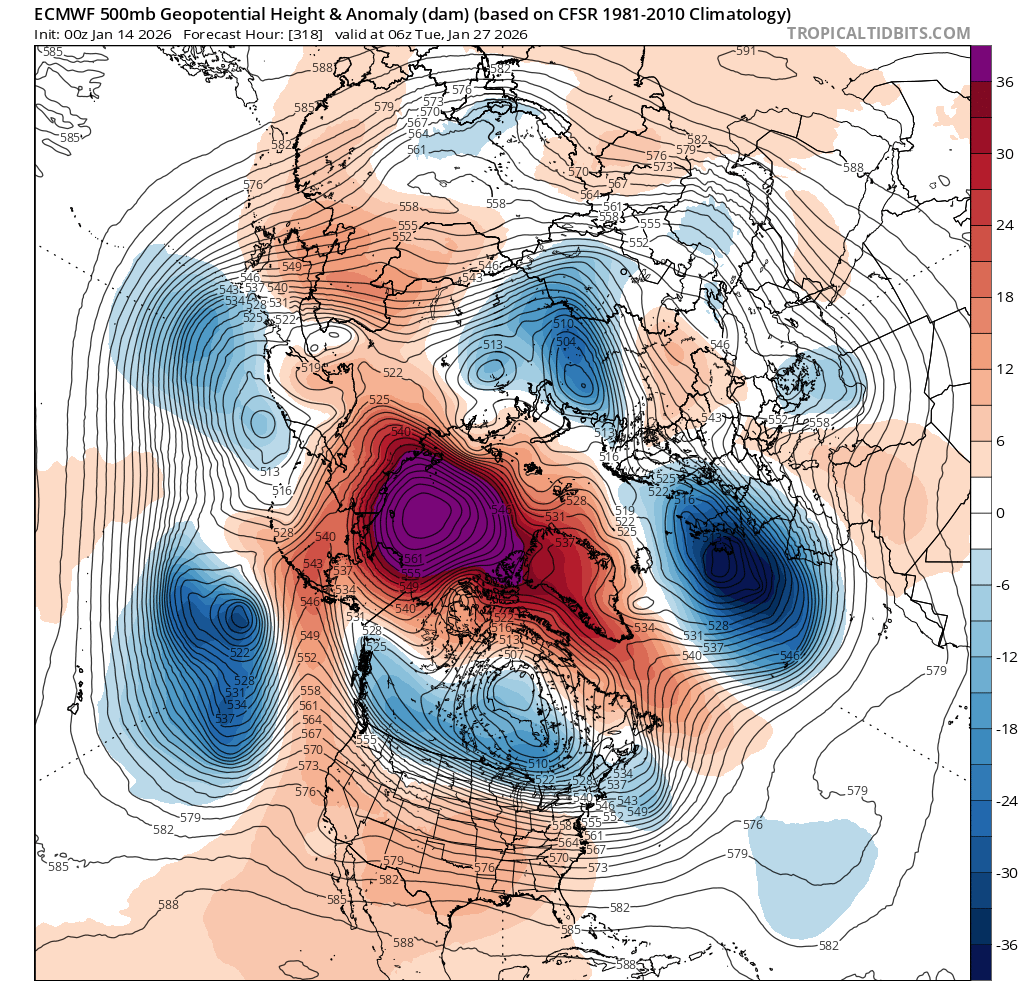
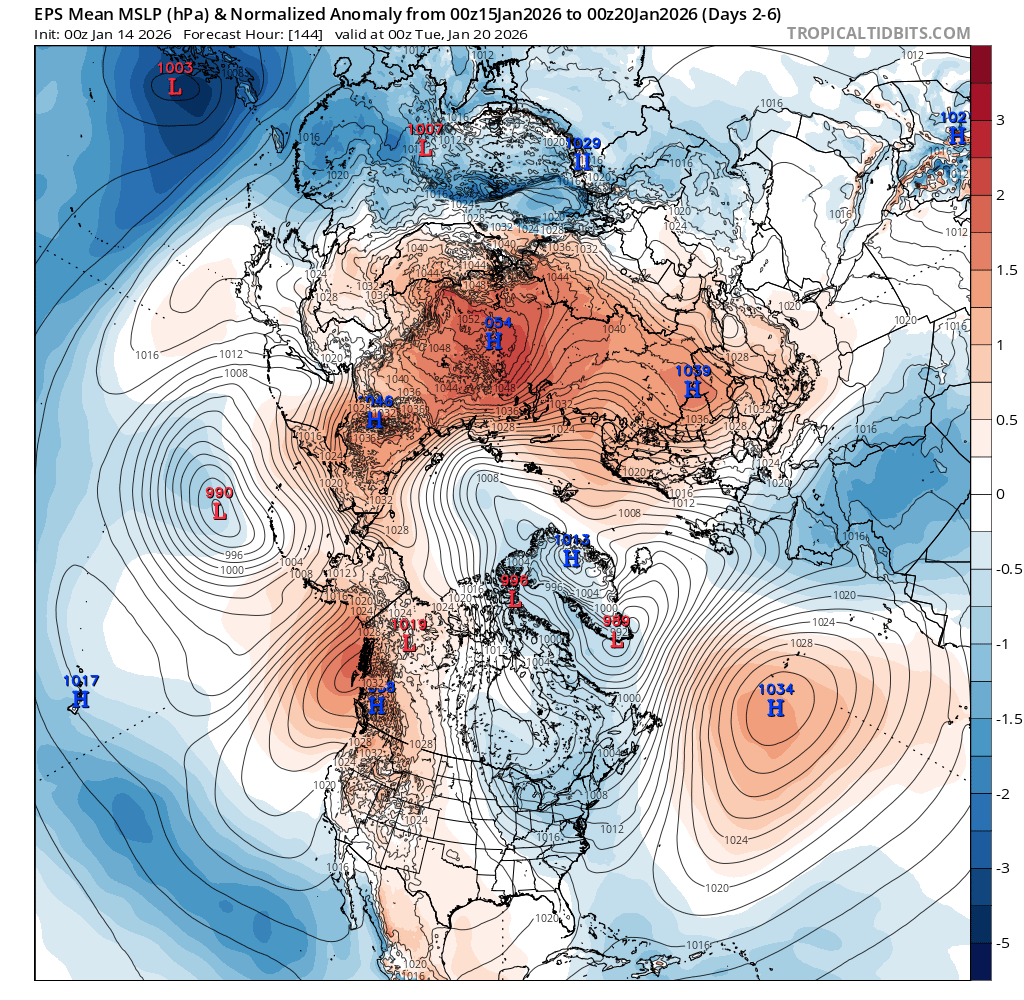
In the next week forecasts look like continued disruption to the NH jetstream resulting in more cold blasts for North America, and the last few runs in EPS/GEPS have shown a high developing over the Arctic afterwards for the remainder of the month, resulting in the cold Arctic air dropping down over Russia, US, Canada for the last week of the month; apparently this is a rare scenario....
Given that there hasn't been great consistency among runs this far out its hard to have great trust this specific scenario -- the jetstream weakening over the Aleutian islands and the high there shifting poleward.
~
Looking back to the first few forecasts from the beginning of the month it looks like I have done fairly poorly in my expectations for week 3 (much more disruption to the jetstream than I expected and troughing for NH, yet also fairly sustained cold temps for Siberia ).
looks the forecast high over the next week over Russia is a good 1-2 std dev above climatology....
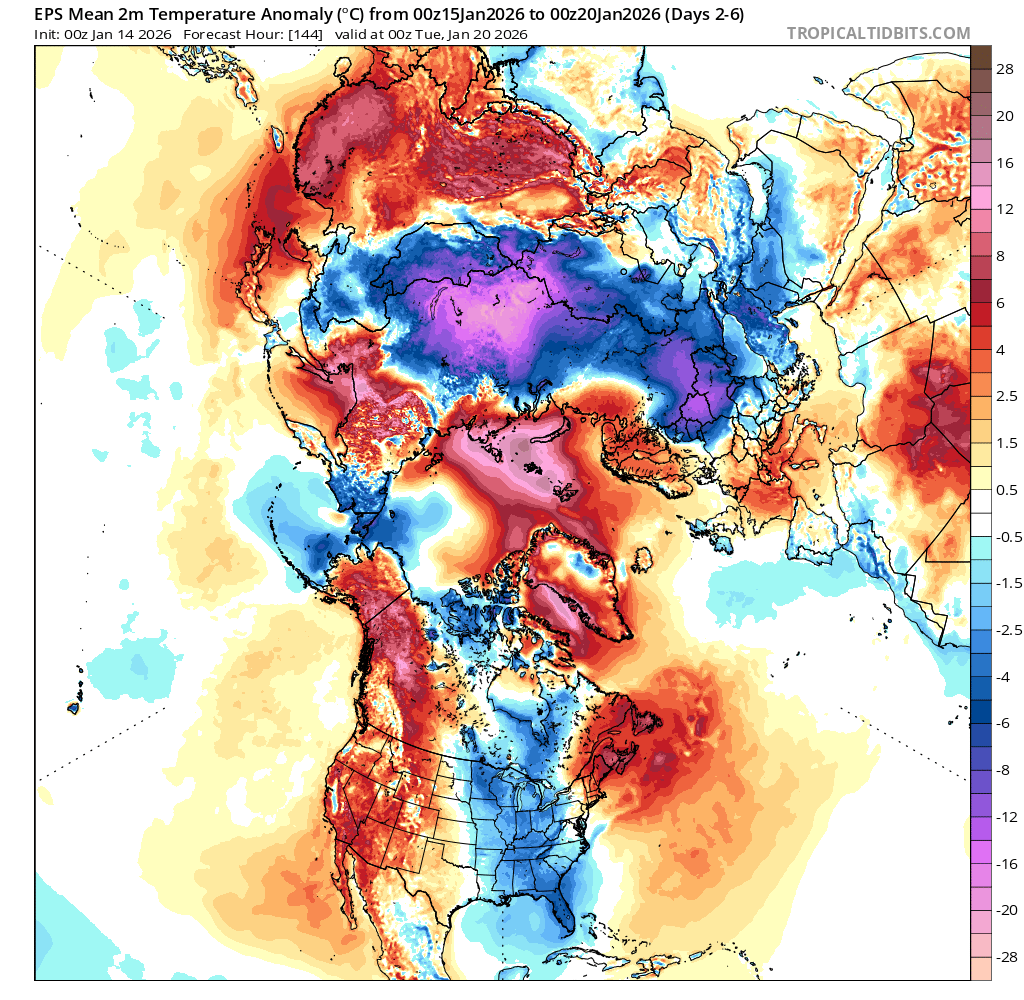
It seems the anomalously high temps in the Arctic especially, but also China, the Sahel, and southern Australia are reasons for it not remaining flat for the last week and why we end up with a forecasted rise after week 3.
Depending on what shakes out, the drop in temp for the 2nd half of the month is on track to becoming around the 4th or 5th largest drop (from 1940+) based on what various adhoc metric you use (i.e. relative to the first half of the month, or relative to the mean of a shorter window from a few days prior)...

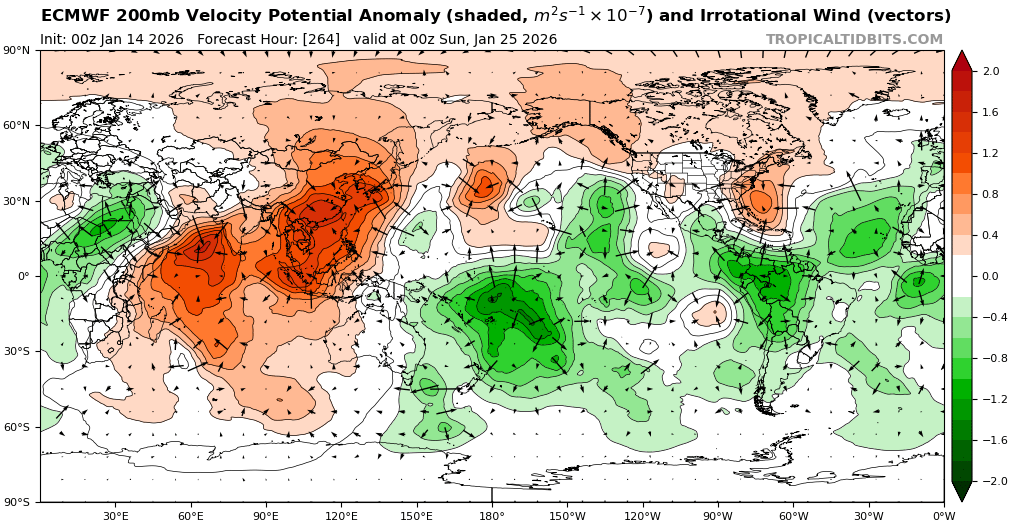
Examining the det. models and the ensembles for the runs of the last 3 days it appears there is a trend towards a weakening of the MJO towards the end of the month as it moves into phase 8.
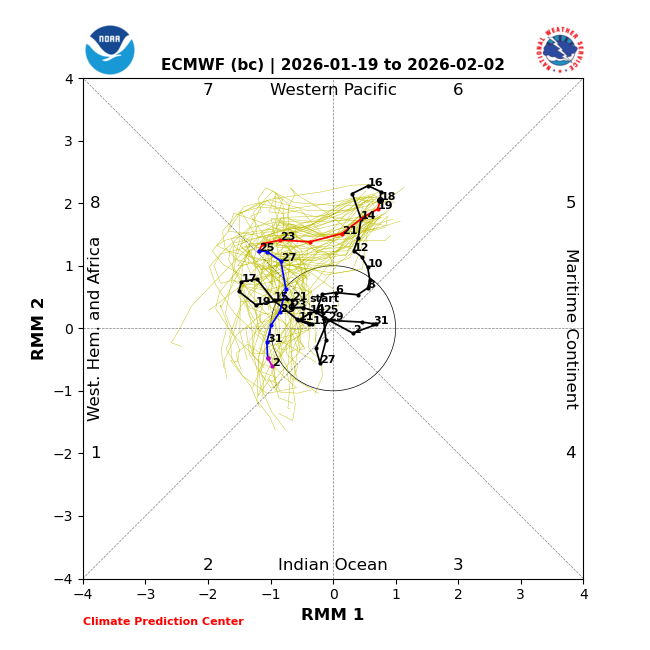
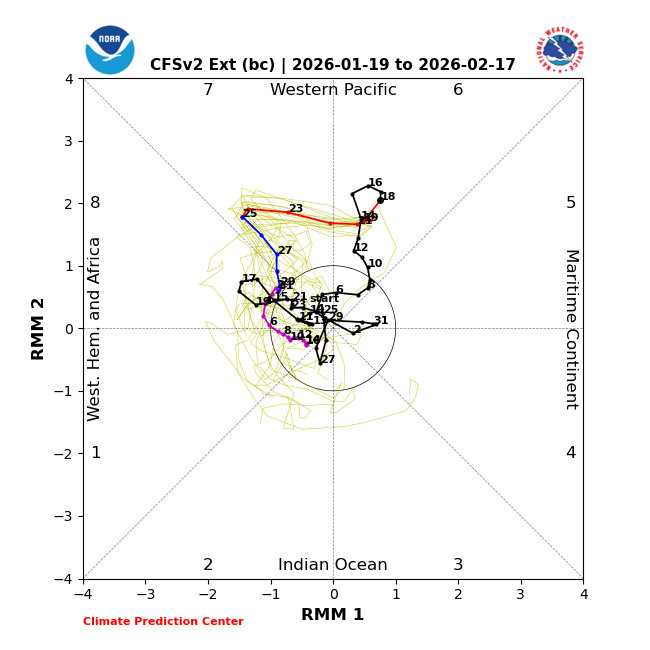
Given the increasing trend in global temps over these runs now ... I don't think I should be more aggressive than I am now....
