Data is currently at
https://data.giss.nasa.gov/gistemp/tabledata_v4/GLB.Ts+dSST.csv
or
https://data.giss.nasa.gov/gistemp/tabledata_v4/GLB.Ts+dSST.txt
(or such updated location for this Gistemp v4 LOTI data)
January 2024 might show as 124 in hundredths of a degree C, this is +1.24C above the 1951-1980 base period. If it shows as 1.22 then it is in degrees i.e. 1.22C. Same logic/interpretation as this will be applied.
If the version or base period changes then I will consult with traders over what is best way for any such change to have least effect on betting positions or consider N/A if it is unclear what the sensible least effect resolution should be.
Numbers expected to be displayed to hundredth of a degree. The extra digit used here is to ensure understanding that +1.20C resolves to an exceed 1.195C option.
Resolves per first update seen by me or posted as long, as there is no reason to think data shown is significantly in error. If there is reason to think there may be an error then resolution will be delayed at least 24 hours. Minor later update should not cause a need to re-resolve.
 1,000
1,000Notable temperature rise over first 14 days of May in medium range super ensemble forecast, as the rise (using a lin. reg.) for the first 14 days of May would be ranked 6th out of 87 years if the current forecast validates (a 0.64 C difference from May 14 to May 1).
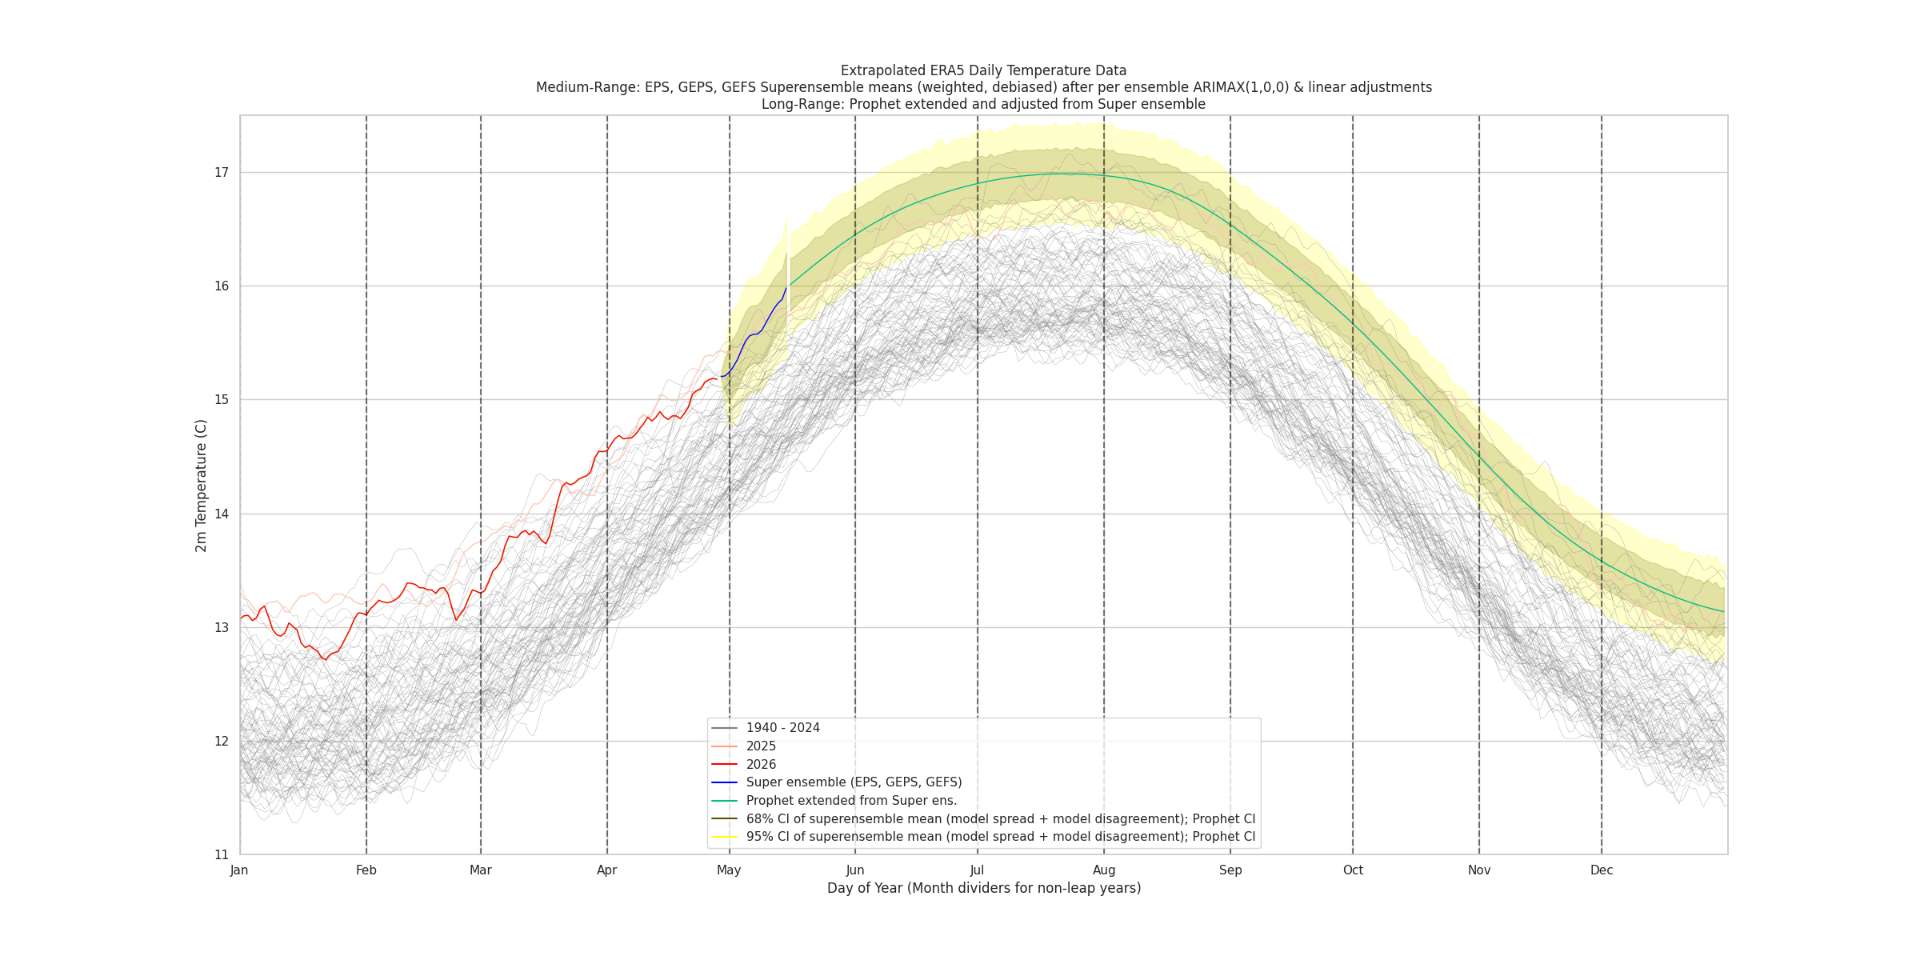
ranking of May 1-14:
1968: 0.05661318681318699
2002: 0.054540659340659346
2003: 0.0510989010989007
2012: 0.04960439560439526
1980: 0.047881318681318605
2026: 0.04756657045929035
1960: 0.04687032967032967
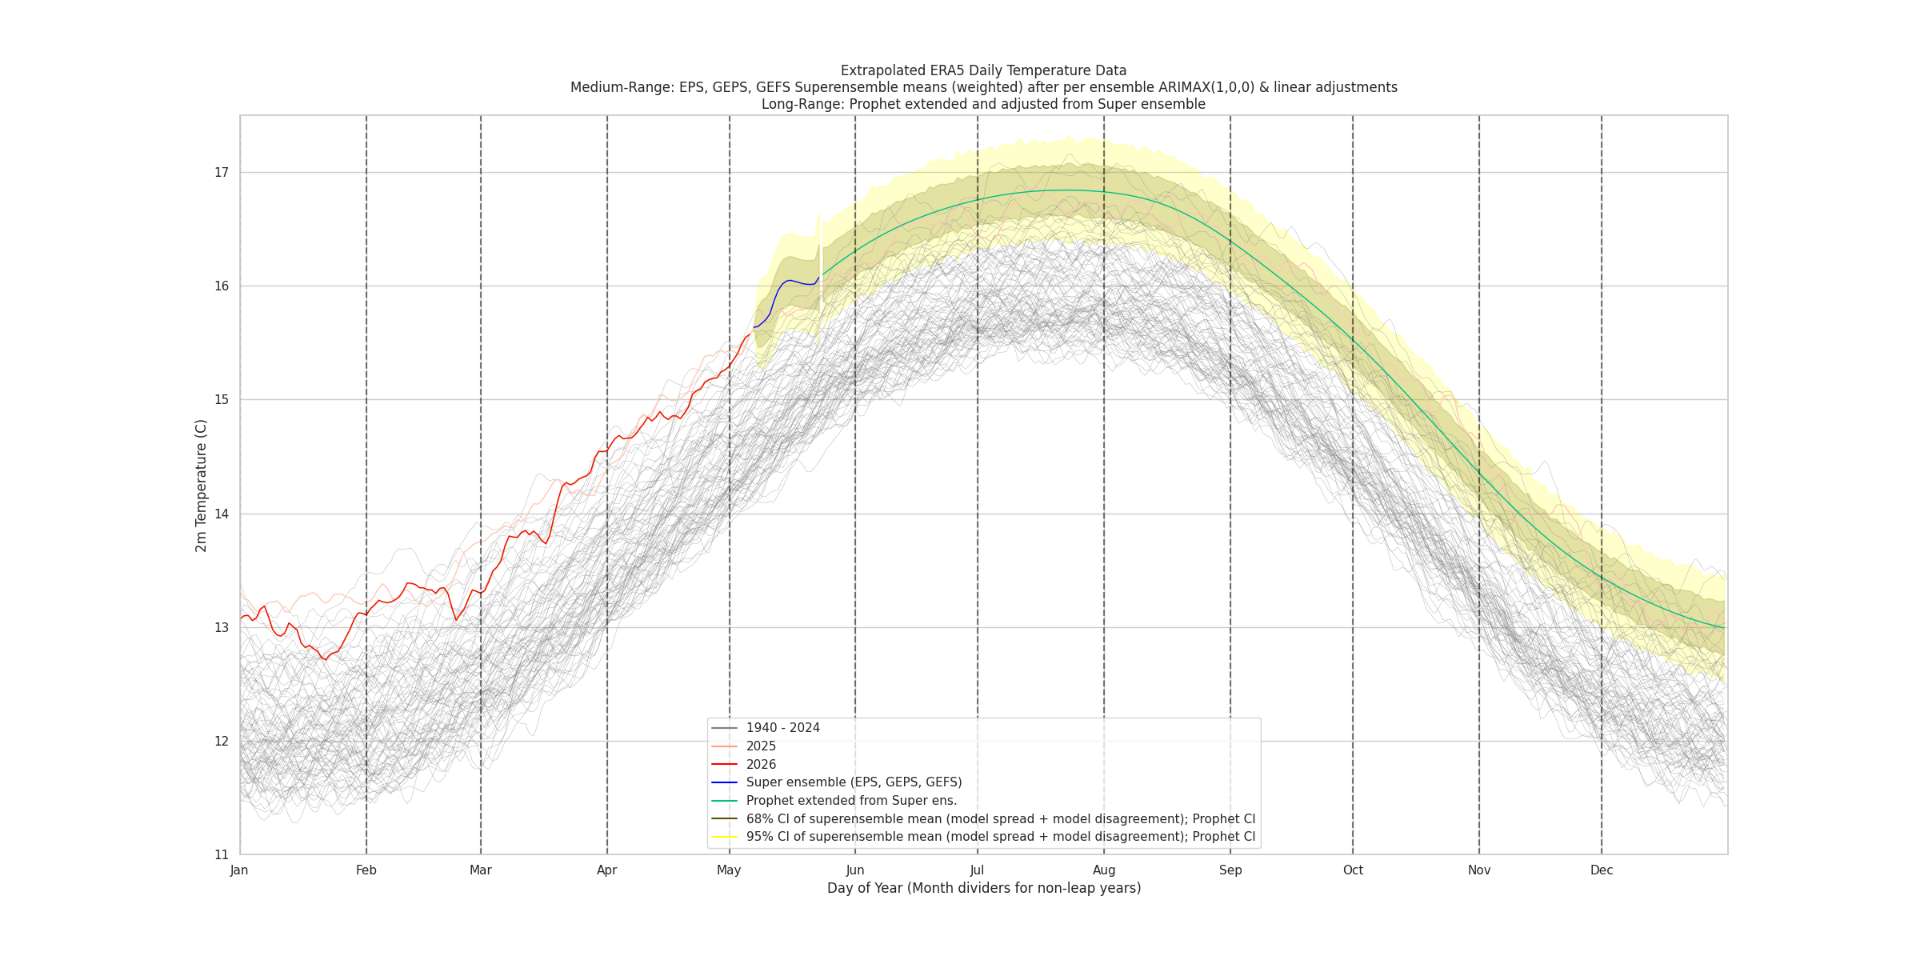
A week later, at this point the first week of May looks like it has validated and the second week forecast has gone even higher, with the slope over these two weeks ranking it 3rd out of 87 years (a 0.72 C difference from May 14 to May 1)...
1968: 0.05661318681318699
2002: 0.054540659340659346
2026: 0.05112604117877309
2003: 0.0510989010989007
2012: 0.04960439560439526
1980: 0.047881318681318605
After looking at the CFS weekly that appears to show a much less anomalous end of the month then the middle (especially Antarctica)..
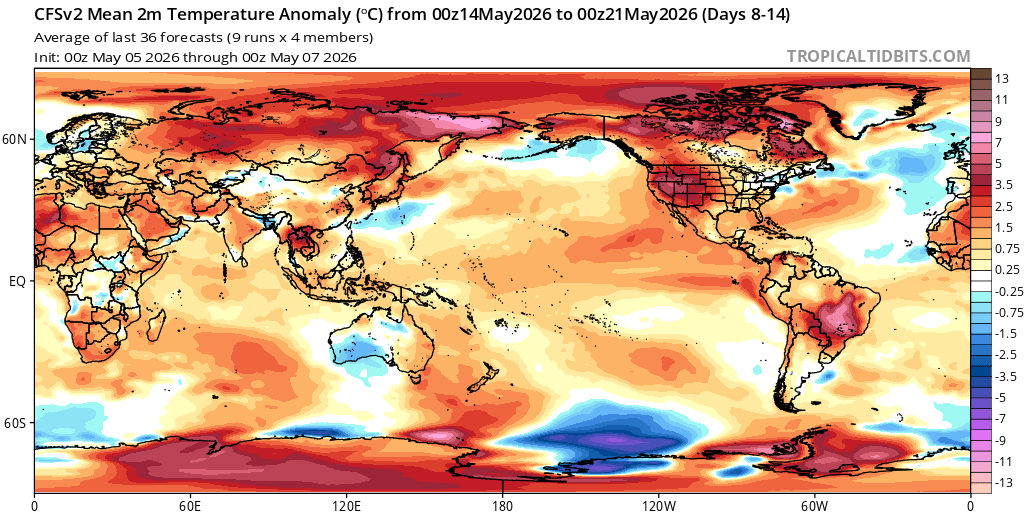
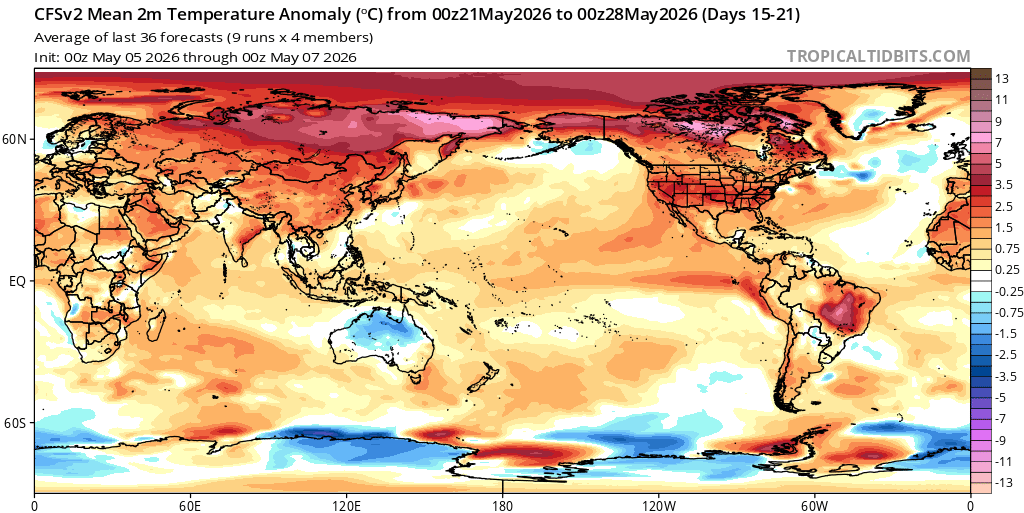
It spurred me to then spend sometime looking at the long range GEFS from a couple days ago to see if it has a different opinion then the climatology or what appears that CFS might be showing (from just visually).
Rather than comparing absolute values, I compare the day-over-day changes between the final adjusted temps from the super ensemble (after adjusting for its long term biases), and the GEFS long range (from wednesday -- a couple days ago):
>>> (final_deltas - gefs_long_deltas).iloc[-9:]
valid_date
2026-05-23 0.016614
2026-05-24 -0.001179
2026-05-25 -0.003278
2026-05-26 -0.016506
2026-05-27 -0.005293
2026-05-28 -0.006945
2026-05-29 -0.013297
2026-05-30 -0.012357
2026-05-31 -0.009789
Technically for the 23rd we only have GEPS/GEFS (no EPS so I included it as reference; 24th onwards is the usual adjusted Prophet extrapolation after all adjustments).
Integrating the deltas requires a bit of code but then it comes out that GEFS long range is about +0.0239 C on average over what I already had for the last 8 days. This is actually a small contribution, that amounts to a suggestion of about +0.006 C for the month.
Given how much worse GEFS long range is compared to climatology usually, I'm going to still assume the climatology is a better judge at the long range, given that it doesn't amount to anything wildly different and the trend is roughly consistent (although a bit less steep than GEFS long range) (not anything too concerning to discount the Prophet extrapolation).
~
Comparing the mean subboxes from April 2026 and April 2024 from the latest gistemp run..
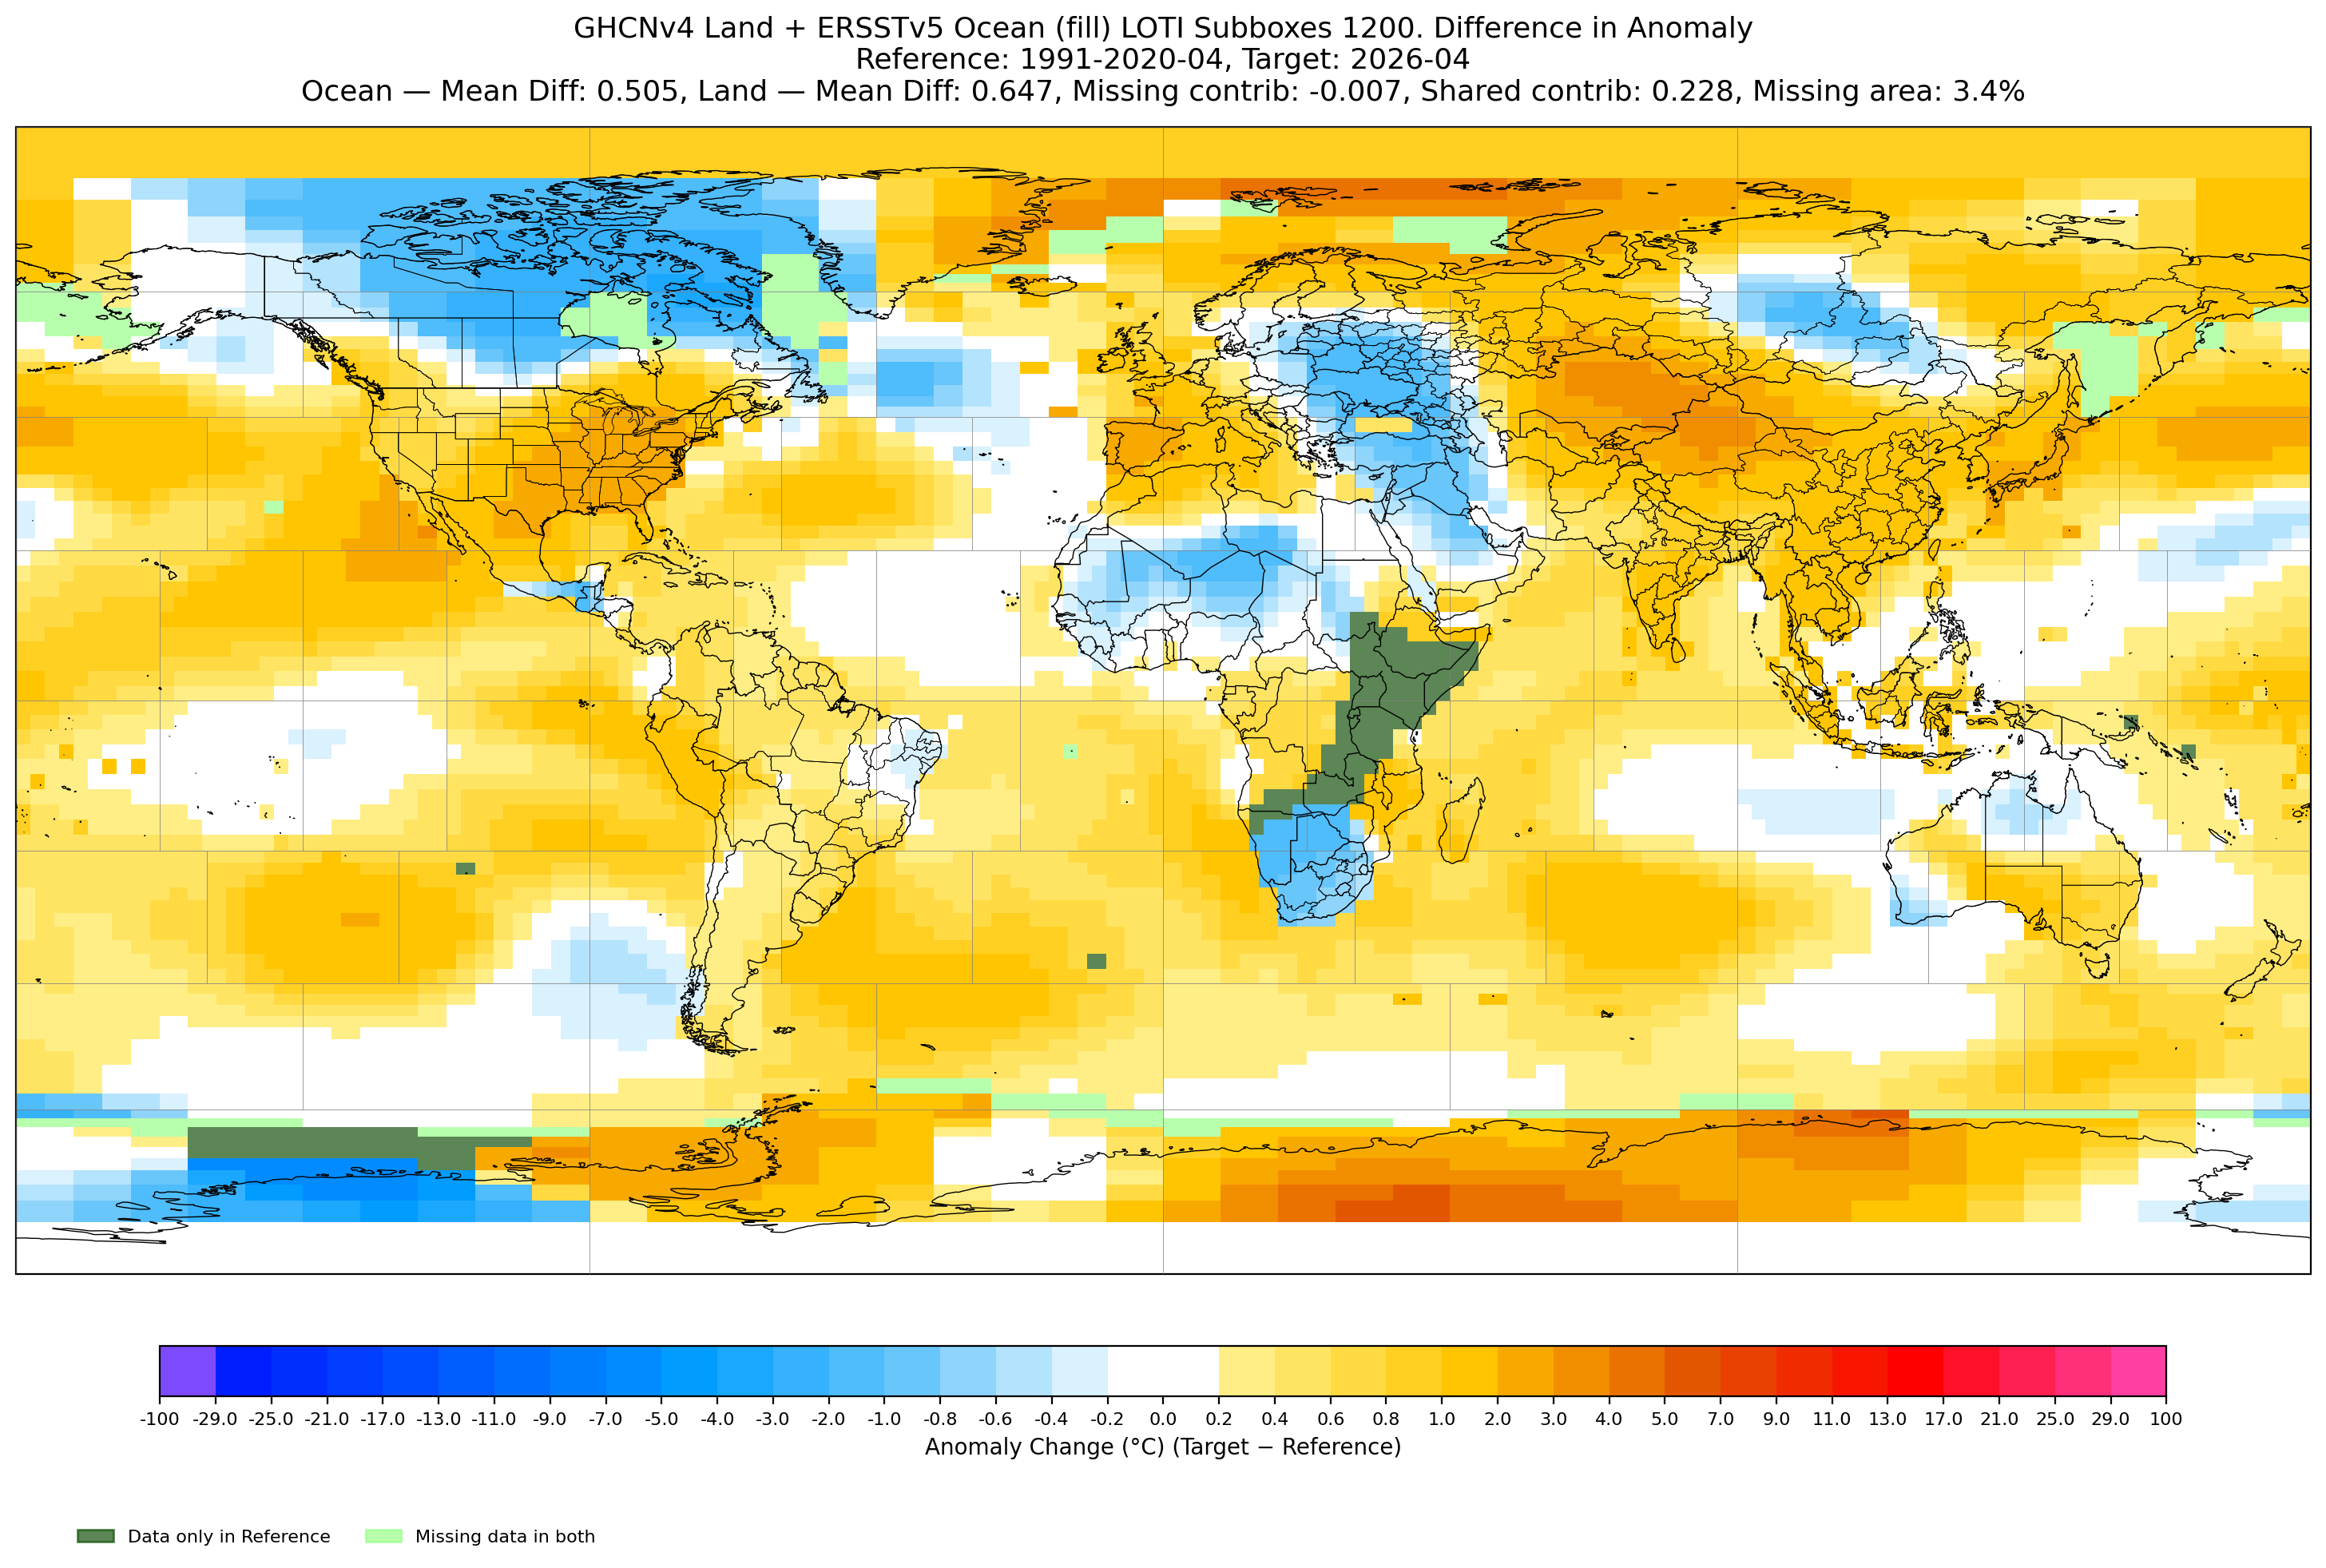
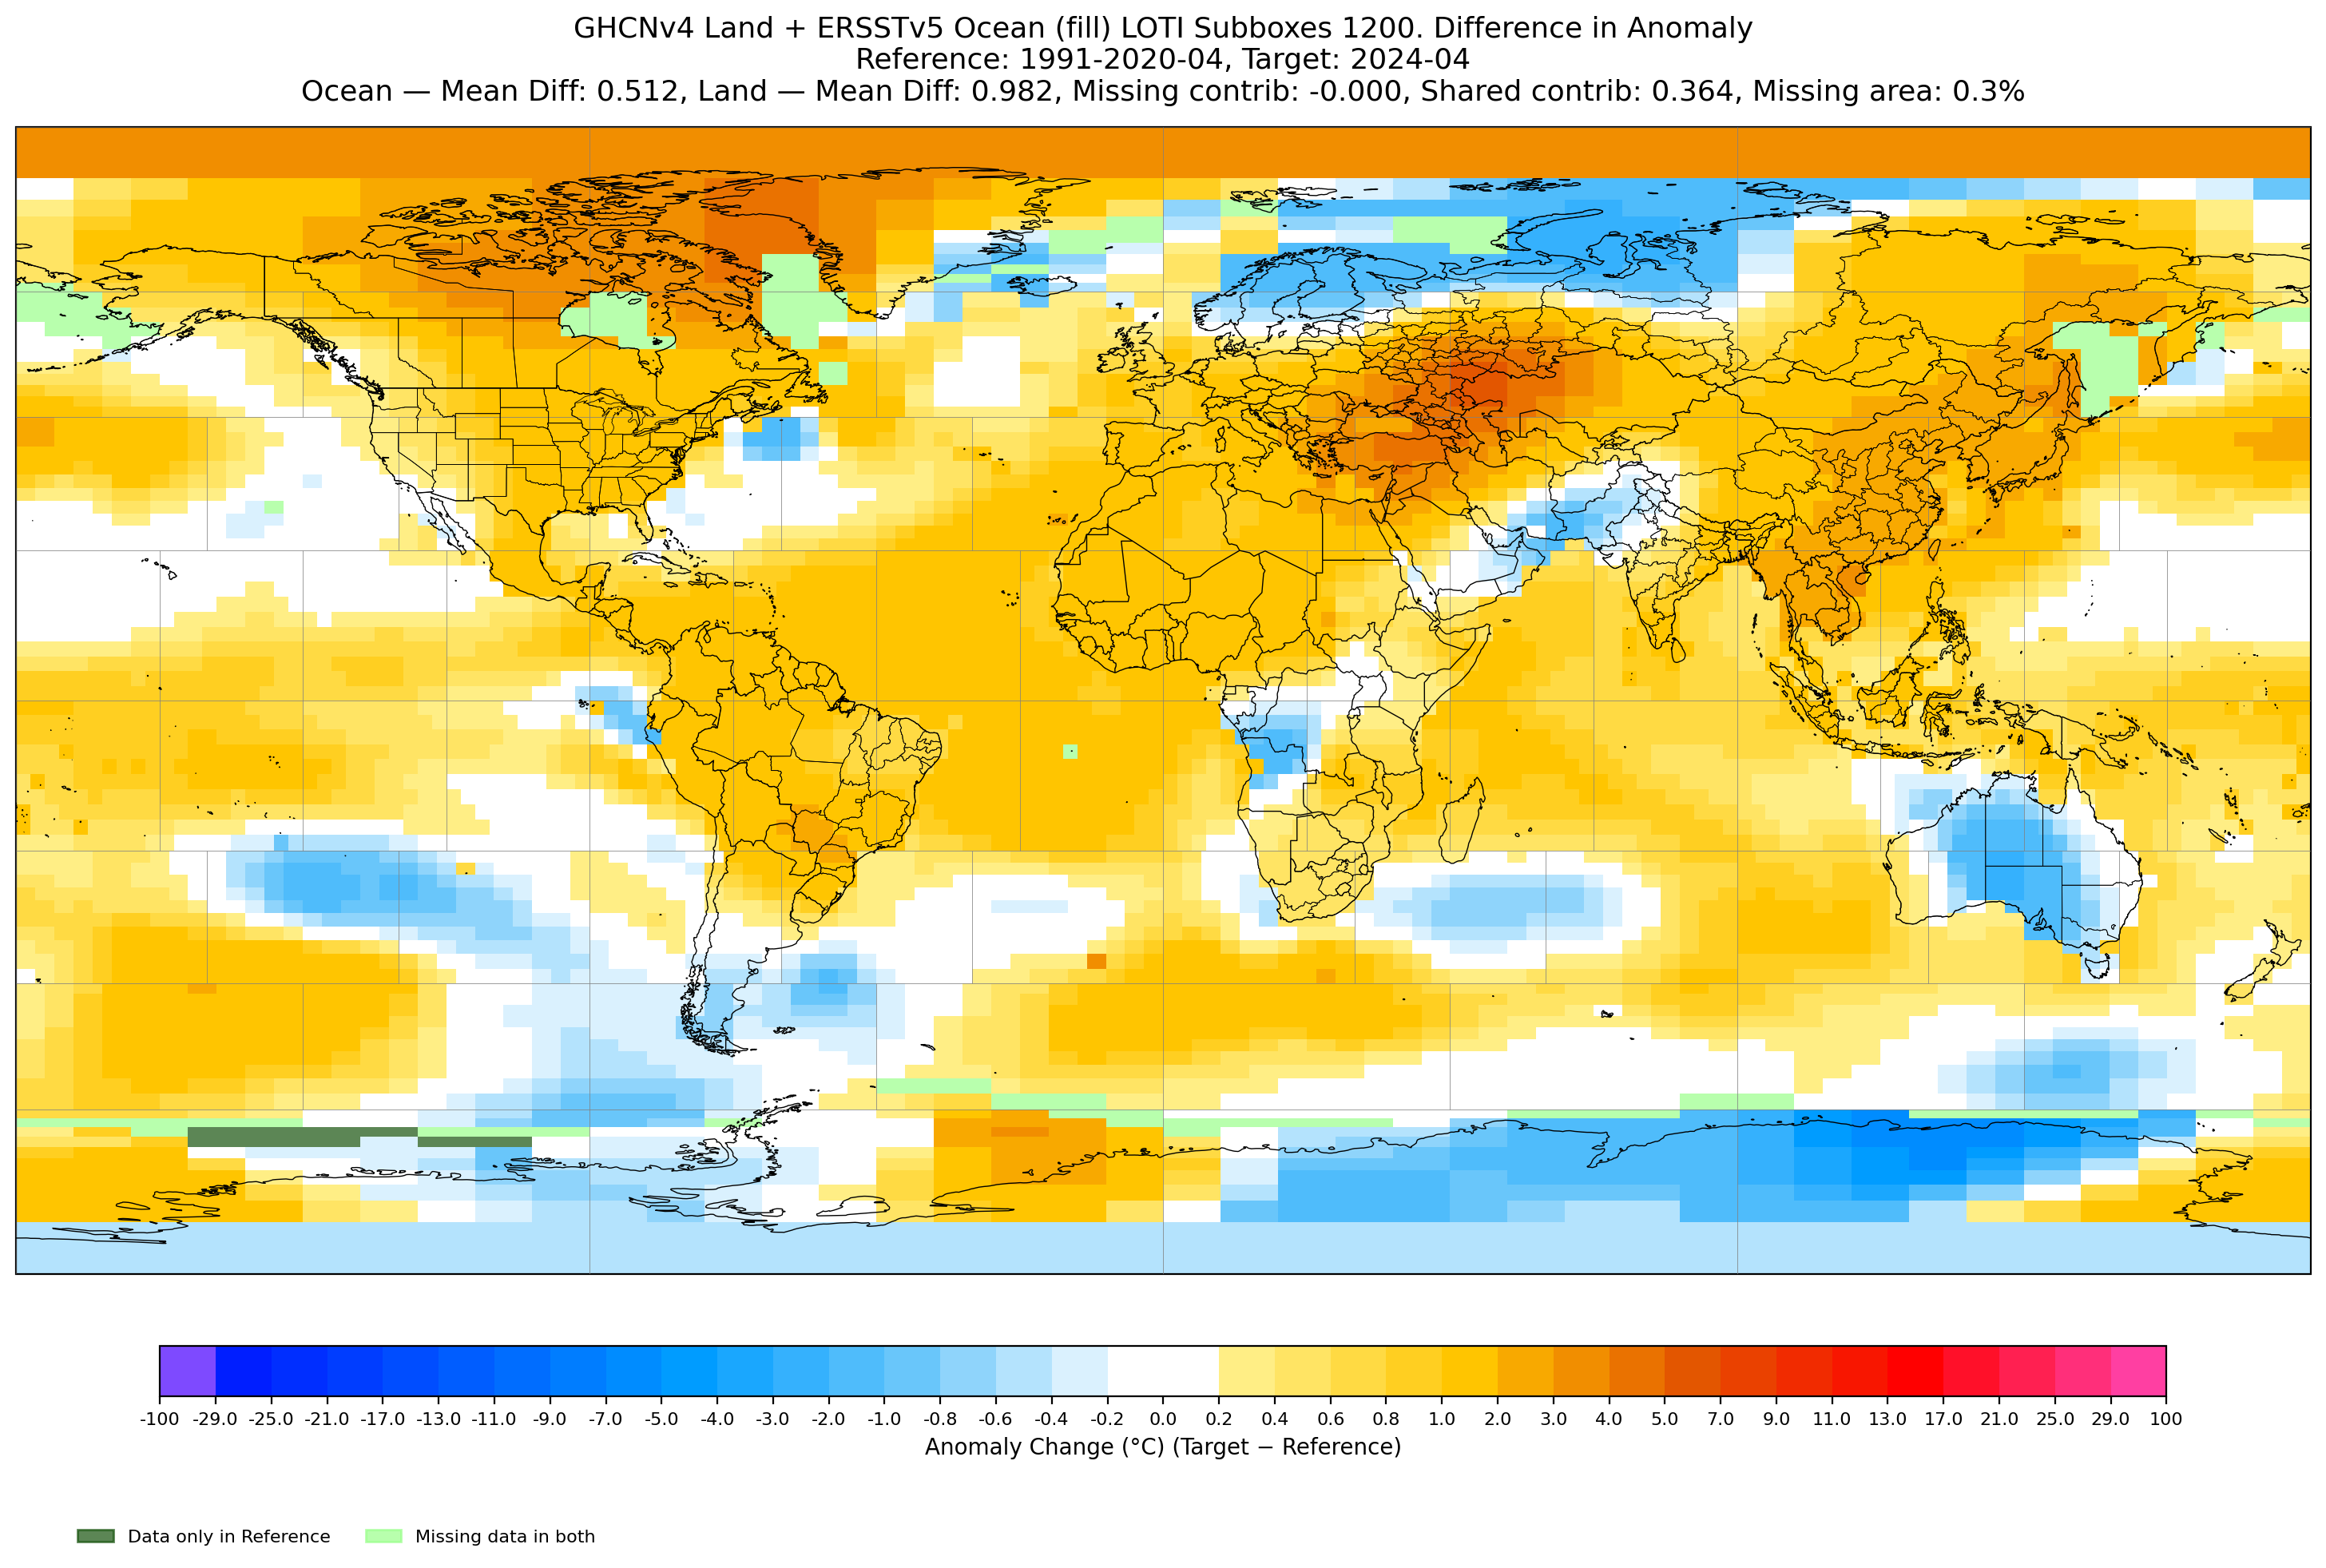
Using the mean of these subboxes (equally weighted), the ocean was only a tiny bit cooler in 2026 (-0.007), but the land anomaly was significantly cooler in 2026 than 2024 (-0.335 C). This makes it the best analog...
~
The first two weeks of May 2024's rise (slope of 0.02489) is roughly half of what 2026 is forecast to be, although there is a plateau and a slight drop in the forecast for 2026 for the 3rd week.
As I've had some poor performance mainly with the old, basic ERA5->GISTEMP model I developed a couple years ago (the p-value for the monthly model of May for instance is 0.09 given the 1940 offset start year, but using an offset of 1950 reveals a p-value of 0.54, resulting in needing to use the yearly model; so I need to to revisit this to come up less brittle scorer / revise the whole model).
For now I compare the ERA5 data directly from May: 2026 is forecast about 0.004C warmer than 2024 in terms of t2m (gistemp has 2024 as 1.1591 for reference). The old GISTEMP->ERA5 monthly model for May 2026 (offset 1940+) would put it unadjusted at 1.19 and the yearly model (1950+) at 1.21. Given the below I'm more tempted to investigate whether recent analogs are better...
Comparing ERA
>>> final_may['2t_adj']
valid_date_month
1940-05-01 14.745484
1941-05-01 14.654323
1942-05-01 14.653065
1943-05-01 14.632097
1944-05-01 14.663581
...
2023-05-01 15.656968
2024-05-01 15.913581
2025-05-01 15.792226
2026-05-01 15.918095
Comparing April as well:
>>> final_april['2t_adj']
valid_date_month
1940-04-01 13.756900
1941-04-01 13.554867
1942-04-01 13.558367
1943-04-01 13.589467
1944-04-01 13.731333
...
2023-04-01 14.682133
2024-04-01 15.031800
2025-04-01 14.962900
2026-04-01 14.885267
For the above, April ERA5 (2026-2024): 14.885 - 15.032 = -0.147
While for GISTEMP April it was (likely): 1.1773 - 1.31358 = -0.136
-0.136 - -0.147 ~= 0.011 C
This isn't bad.. (using 2024 as an analog for 2025, the value is even smaller at ~ -0.003)
What is it for May then for ERA5 (2026 - 2024) after all adjustments for 2026?
15.918095 - 15.913581 ~= 0.005
GISTEMP for May 2024 was ~ 1.159
Suggesting a May 2026 of 1.159 + 0.005 = 1.164 C
This is below what I get (without adjusting for own past forecast errors) with the old GISTEMP->ERA5 model of 1.189 C (and a yearly model using a 1950+ offset of 1.214 C).
Given the other recent delta analog models I've been using has performed better recently I'm leaning towards this other, ad-hoc calculation using 2024 as an analog for another week until the medium range ensemble covers the end of the forecast, or until I do some actual statistical tests to see which works better.